
.NET Memory usage - A restaurant analogy
My favorite author Simon Singh is a wiz at analogies. In his book The big bang he explains concepts like the doppler effect and the theory of relativity using analogies with frogs and trains that makes it not only easy to understand but you will remember them forever because of the picture they paint in your head.
The other day at work I heard one of my colleagues explaining memory usage and why you get out of memory exceptions to one of his customers using a restaurant analogy. I’ve talked about OOMs and memory management in an earlier post but I found the analogy so amusing that I thought I’d share it (and yes, before you say it, I do admit I might have stretched the analogy a little too far:), and that it doesn’t hold a candle to Simon Singhs analogies, but then again he sells books and i just rant in a blog…).
Disclaimer: In order to not get too long winded I will simplify a lot of things, and say that for example the GC allocates 64 MB segments even though this differs between different framework versions and the size of the objects you allocate (read large object heap). Some other details are also dependent on configuration settings (i.e. using the /3GB switch etc.) but I will exclude such details from the analogy.
Analogy Part 1 - General memory usage
If you have read my earlier posts you will know that a process on a 32-bit system can typically address 2 GB of virtual address space. This is the memory that you have to work with, independently of how much RAM you have. More RAM is good for performance since you page less with more RAM, but it doesn’t do anything to expand the 2 GB address space.
Picture this 2 GB address space as being the floor space of a restaurant.
When you allocate an object (whether it is .net or non-.net) you typically follow a two step process. You reserve the memory and then you commit space inside your reservation.
The reservation is equal to reserving a table at the restaurant. And just like in a restaurant, depending on the memory manager you use (we will get to that later) you will reserve the memory in chunks. Let’s say for example you are a party of 3. It is not likely that there will be a table for 3 in the restaurant, but rather you would get a table for 4 out of which you use 3 seats and waste one seat.
In memory terms the space for the table you have reserved is called reserved memory (virtual bytes), and the actual space you use (for the 3 seats) is committed memory (private bytes). The floor space that is not yet reserved is free memory.
On a pretty good restaurant night your restaurant/memory might look something like this where the blue areas are reserved space, red means committed space and white is free space.
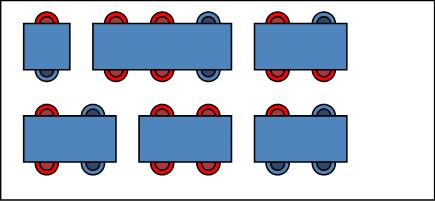
Now, if someone calls in to make a reservation for 3 they will get the answer that the restaurant is full, since the only way to seat 3 people together is to seat them on a 4 seat table. Even though you could fit in two 2-seat tables that wouldn’t be good since they all want to sit together.
Similarly, when you make memory allocations you won’t split a memory reservation out into different locations, it has to be allocated in one chunk or not at all. So the memory result in this case would be “out of memory”, even though there is plenty of space left.
An observant person might also note that if we put the tables closer together so that they are completely side-by-side you could easily fit in a new table of 4, but reserved memory areas much like tables at some restaurants can’t be moved.
When we talk about memory fragmentation we either talk about the free but unusable (because it is not large enough to fit a new table) we have, or how much of our reserved memory we are not using (difference between virtual bytes and private bytes).
Analogy Part 2 - The .NET GC
Most of the time when you create objects in an application, whether it is .NET or not you use some kind of memory manager (NTHeap, C++ Heap, GC etc.), and in the restaurant case you can think of the memory manager as an hostess that reserves seats for you and ushers you to the location where you are to be seated. For example if you call malloc you don’t have to provide an address where you want your allocation to lie, instead you say that you want memory of a certain size and malloc returns, ok, you will be seated at table 1 in the “C++ heap” area.
The .NET GC takes this one step further and pre-reserves a large table for anyone who might want to use .NET objects in the process (let’s say a 64 seat table). And when anyone creates a .NET object, the GC ushers them to the next available seat on that table. Once in a while the usher will walk around the table to check if someone is done eating and ask them to leave, and then scoots the rest of the people down the table. Some people might be waiting on other people to finish up before they can leave (references), so they get to stay too. And some people may be really annoying and say, dude, i got a window seat, i am sooo not moving (pinned objects) which means that the rest of the people can’t be scooted down towards the end of the table either.
Any empty seats between people are referred to as .NET memory fragmentation.
Once the 64 seat table is filled up the GC needs to reserve a new 64 seat table if it needs to accomodate newcommers, and if it can’t you will get an out of memory exception.
But, how does it really look
Ok, enough with the analogy, here is what memory looks like in a real ASP.NET application
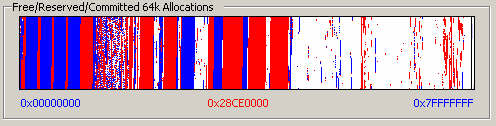
Again, the red parts are committed memory, the blue parts are reserved memory that is not committed and the white space is free space.
The dots you see towards the end of the memory space are probably dlls, and although just like in the restaurant scenario there is a lot of white space, it is likely that none of the gaps between the small red dots are large enough to house a 64 MB segment and thus the next time we fill up a GC segment and need a new one to accommodate a new object, we will get an OutOfMemoryException.
The reason these small red dots (dlls) are spaced out like this is because they are loading at the preferred base addresses for those particular dlls. You can’t really do much about that type of fragmentation since it is hard to know in advance what a “good” preferred base address would be, but what you can do something about is finding out where the memory you are actually using is going.
A comment on performance counters and how not to use task manager
Throughout the analogy I talked about private bytes and virtual bytes and these are the two most important performance counters to look at when defining memory usage or memory leaks.
There is another counter called working set which simplified consists of how much memory is in the memory pages that are currently or was recently touched by threads in the process or approximately, how much of the memory that is used by the process is currently in RAM. The working set counter might be interesting if you have issues with too much paging and many processes on the same box competing about the RAM, but in order to determine how much memory you are using (reserved or committed) it offers little or no help.
If you want to see this in action, you can create a win forms application and allocate a bunch of objects and see the working set go up, and then if you minimize the app, the working set drops. This doesn’t by any means mean that you have just released all this memory. It just means that you are looking at a counter that is totally irrelevant for determining how much stuff you store in memory :) Yet… this is the counter that people most often look at to determine memory usage…
I know that by now you are probably thinking “yeah right”, you haven’t even heard of this counter before, why would I say that this is the counter most people look at??? The answer is, because most people use task manager to look at memory usage of a process, and specifically look at the Memory Usage column. Surprise surprise :) what this actually shows you is the working set of the process…
If you want to see private bytes which is a far more interesting counter, you should look at the column in task manager that is labeled Virtual Memory Size (yeah, that’s really intuitive :)), or better yet, look in performance monitor at process\private bytes and process\virtual bytes, there is no reason not to if your intent is to investigate high memory usage or a memory leak.
So tonight, go out, grab a bite to eat and see memory management in action :) I bet you will probably find a lot more similarities than the ones me and my pal came up with…
Laters
