
Using Reflector to search through code and resolve .NET issues
As you already know, i spend my days analyzing dumps for customers, and more often than not I don’t have access to the customers code.
I could probably ask for it but it usually takes a long time and even then I often just get partial code, and sometimes, if the customer has multiple environments or if there has been recent changes, the code I would get may not correspond exactly to what was running in production when the dump was taken.
I’m sure many of you are familiar with Lutz Roeder’s Reflector already. I just have to say, I just love this tool, it has made my life soo much easier over the years that it’s not even funny. I constantly have 2-3 sessions open and in case you are not familiar with some of its features I wanted to show how I use it on a daily basis.
Saving the modules
If I have a dump of a process and want to look at the code running inside it I can open it up in windbg and use sos to save the dlls using
!savemodule <base address> <path to save>
And I can get the base address by running lmv mmodulename, or just lm to get all start/base addresses for all modules. Anyways, it gets pretty tedious to do that for all modules so instead I automate it a bit with WinDbg’s !for_each_module, so the command below, saves out all the dlls/exes loaded in the process in binary form so they will be stored on disk pretty much as an exact replica of the dll loaded in the process…
0:000> !for_each_module !savemodule ${@#Base} f:\blog\modules\${@#ModuleName}.dll
01000000
5 sections in file at 00990000
section 0 - VA=1000, VASize=7f749, FileAddr=400, FileSize=7f800
section 1 - VA=81000, VASize=490, FileAddr=7fc00, FileSize=600
section 2 - VA=82000, VASize=237c, FileAddr=80200, FileSize=2000
section 3 - VA=85000, VASize=3d8, FileAddr=82200, FileSize=400
section 4 - VA=86000, VASize=5404, FileAddr=82600, FileSize=5600
Successfully saved file: f:\blog\modules\oleaut32.dll
01000000
4 sections in file at 00a20000
section 0 - VA=1000, VASize=498f4, FileAddr=400, FileSize=49a00
section 1 - VA=4b000, VASize=1054, FileAddr=49e00, FileSize=c00
section 2 - VA=4d000, VASize=1598, FileAddr=4aa00, FileSize=1600
section 3 - VA=4f000, VASize=26ec, FileAddr=4c000, FileSize=2800
Successfully saved file: f:\blog\modules\shlwapi.dll
00040000
3 sections in file at 00f60000
section 0 - VA=2000, VASize=2954, FileAddr=200, FileSize=2a00
section 1 - VA=6000, VASize=2a8, FileAddr=2c00, FileSize=400
section 2 - VA=8000, VASize=c, FileAddr=3000, FileSize=200
Successfully saved file: f:\blog\modules\y9w_t4cv.dll
00040000
3 sections in file at 00f70000
section 0 - VA=2000, VASize=2954, FileAddr=200, FileSize=2a00
section 1 - VA=6000, VASize=2a8, FileAddr=2c00, FileSize=400
section 2 - VA=8000, VASize=c, FileAddr=3000, FileSize=200
Successfully saved file: f:\blog\modules\ibyunanw.dll
00040000
3 sections in file at 00f80000
section 0 - VA=2000, VASize=2954, FileAddr=200, FileSize=2a00
section 1 - VA=6000, VASize=2a8, FileAddr=2c00, FileSize=400
section 2 - VA=8000, VASize=c, FileAddr=3000, FileSize=200
Successfully saved file: f:\blog\modules\th5r9oei.dll
00040000
3 sections in file at 00f90000
section 0 - VA=2000, VASize=2954, FileAddr=200, FileSize=2a00
section 1 - VA=6000, VASize=2a8, FileAddr=2c00, FileSize=400
section 2 - VA=8000, VASize=c, FileAddr=3000, FileSize=200
Successfully saved file: f:\blog\modules\t0i_pxyo.dll
...
Opening in reflector
In order to get all the code running in the process i just open a new instance of reflector, clean out any previously opened dlls and do file/open, selecting all the modules i just saved.
Sometimes you need to close out dlls like System.dll System.Xml.dll etc. that have native images and open those directly from the framework directory instead.
Searching in reflector
Let’s say I want to debug the issue described in this post, where we are leaking dynamic assemblies because we are creating new XmlSerializers, and we want to know where in our code we might be creating these…
I would use the search function, searching for types to find XmlSerializer
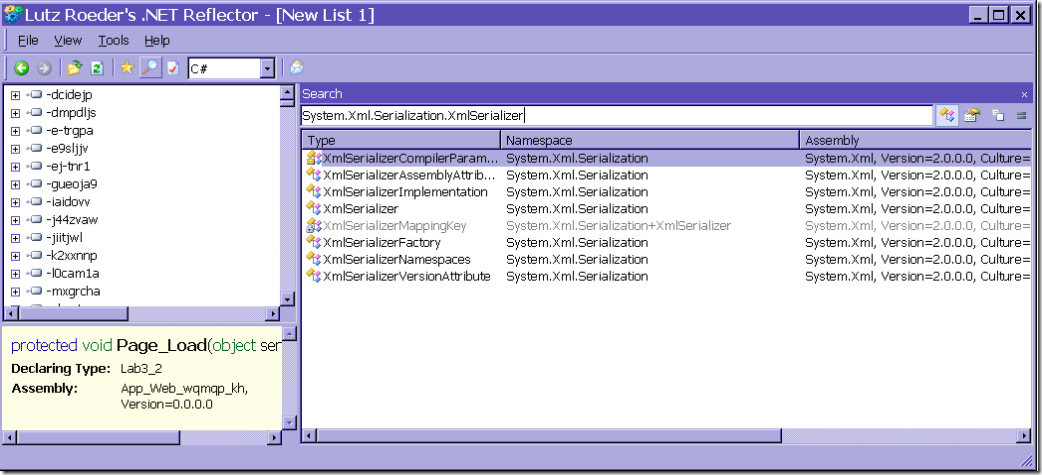
And then just double click on the XmlSerializer option to explore that class.
Btw, it has great member search and string/constant search options as well if you need that.
Finding out who calls it
Once we have found the XmlSerializer class we can take one of the methods we are interested in (in this case any of the XmlSerializer constructors that generate dynamic assemblies without caching them) and right-click and choose Analyze.
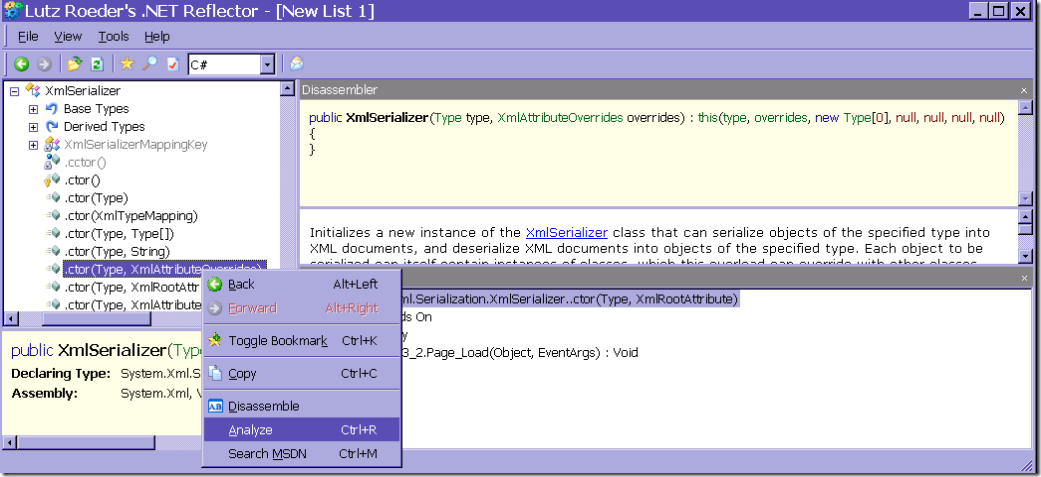
This opens the Analyzer pane where we can expand the Used By node to find out who is calling this method…
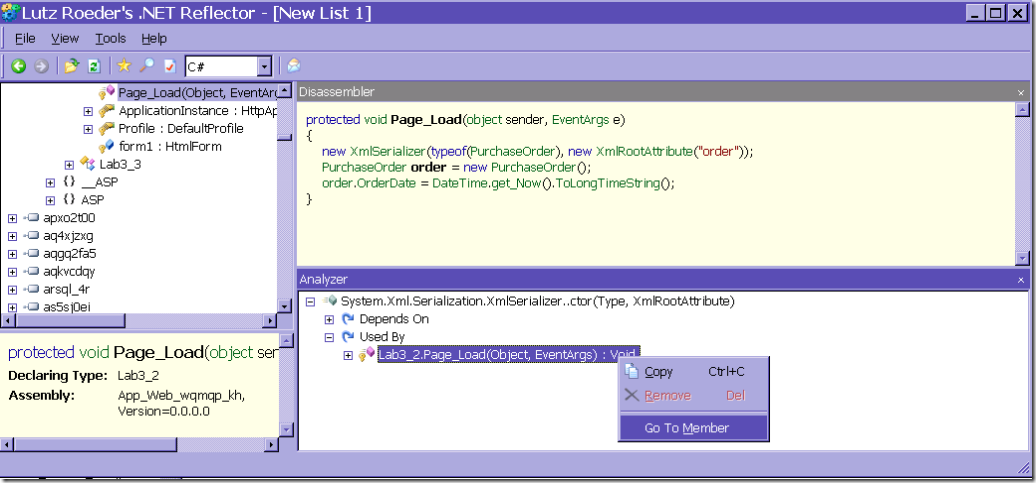
And in this case it tells us that the only method that is using this constructor, in the code loaded in the process, is Lab3_2.Page_Load. And if we right click and choose Go To Member we can even see the code for this in the Disassembler pane so we can see how it calls it.
And that way we can pinpoint the exact line of code that caused this assembly leak.
Laters, Tess
