
High memory usage with usercontrols in IE (using Debug Diag)
I was helping a colleague with an interesting case yesterday concerning a memory leak in IE when using win forms user controls.
We got a nice little repro with a very basic user control that displayed a picture and each time the page was refreshed it appeared to leak quite a bit of memory, and inducing a garbage collection had no effect on the memory.
I started off with setting it up on my machine, and then I used Debug Diag to track down the leak. Debug diag is not all that great for managed/.net memory leaks since the GC manages the memory for you as I’ll show later. but I figured that since I had a repro it was worth a try.
Some notes on how debug diag works
Debug diag is basically a debugging helper that allows you to take memory dumps of a process or set up different rules like crash rules, memory rules, exception rules and hang rules. It also has a leak tracking feature which I will talk about in more detail in a bit, and a number of scripts (and allows you to write your own scripts) for automated analysis. Basically you load up a dump file in debug diag (can even be a dump file gathered with windbg) and choose the script you want (hang, crash or memory) and then Debug Diag will produce a report with stacks and information about what it thinks is the problem.
The downloads page has very nice information concerning how you use Debug Diag to troubleshoot different issues.
Debug diag and memory leaks
This excerpt is copied straight from the downloads page:
To debug memory and handle usage, use one of the following:
- Create a leak rule against the process in question. The leak monitoring feature will track memory allocations inside the process. Tracking is implemented by injecting a DLL (leaktrack.dll) into the specified process and monitoring memory allocations over time. When configuring a memory and handle leak rule, you can specify memory dump generation based on time or memory usage.
- Using the “processes” view, right-click the process in question and select the “monitor for leaks” option. When the process has grown to the suspected problem size, manually dump the process by right-clicking on the same process in the processes view and choosing the “Create Full Userdump” option.
In essence what this means is that any memory that has been allocated and not been de-allocated will be reported as a possible leak. It is very important that you turn on leak tracking for a sufficient amount of time (or raise in memory usage) that you can weed out the real leaks for the stacks that allocated memory recently and just hasn’t had the time to de-allocate it.
Another item worth mentioning is that by default debug diag will not track any stacks for the first 15 minutes (to avoid mixing in all the allocations made on startup which are not really leaks but just getting you up to baseline memory usage).
Debugging the issue
I started up by browsing to the html page that instantiated the user control so that i had everything loaded and then I started up debug diag and then I followed these steps to get a memory dump.
- Since my repro was very quick (way less than 15 minutes) I went in to tools/options and settings in debug diag and checked the box Record call stacks immediately when monitoring for leaks… under the preferences tab.
- In the process tab I found my
iexplore.exeprocess, right clicked it and choose Monitor for leaks - I refreshed the page like crazy to get a a leak of around 200 MB in the IE process
- Then I right clicked the
iexplore.exeprocess under the process tab again and choose Create Full Userdump
Since leaktrack.dll stores all the info about the allocated memory in memory there is a slight overhead that leaktrack itself creates. It is usually not all that significant but I wanted to mention it in case you ever look at a memory analysis and wonder what all the memory on the leaktrack heap is doing.
My next step was to go in to debug diag under the advanced analysis tab and choose Add data files to get my dump analysed, and then I chose Memory Preassure Analyzers from the analysis scripts and hit Start Analysis. After that it is time for a coffee break :)
Back from coffee, debug diag has finished running the analysis and popped up IE with an mhtml file with the results and on top it showed the following…
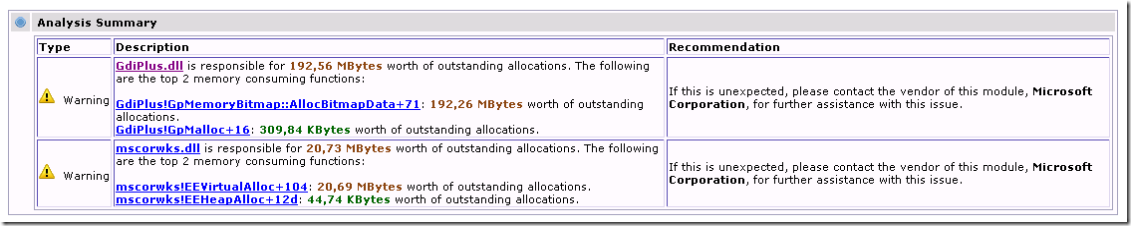
And a little bit further down on the page under leak tracking summary it had this

So from this we can see that we have been tracking for 45 seconds (way shorter than I would normally recommend but this was a quick leak). We have allocated 213 MB and the biggest memory user seems to be GdiPlus.dll (192,56 MB)
Note that mscorwks.dll has used up 20,73 MB. If you have a .net memory leak or high .net memory usage you won’t really see the individual allocators here. All .net leaks will show up as a high amount of outstanding allocations from mscorwks.dll which is why I mentioned earlier that tracking .net leaks with debug diag doesn’t work all that well.
If I click on GdiPlus.dll I will get to a section in the html file with more details about the GdiPlus allocations, including stacks which is extremely useful since it tells you where/why all this memory is allocated…
Call stack sample 1
Address   0x0bc00000
Allocation Time   00:00:11 since tracking started
Allocation Size   5,49 MBytes


Function   Source   Destination
GdiPlus!GpMemoryBitmap::AllocBitmapData+71
GdiPlus!GpMemoryBitmap::AllocBitmapMemory+26
GdiPlus!GpMemoryBitmap::BeginSink+14b
GdiPlus!GpJpegDecoder::CallBeginSink+6c
GdiPlus!get_sos+285
GdiPlus!GpJpegDecoder::Decode+b7
ntdll!NtQueryVirtualMemory+12
kernel32!VirtualQueryEx+1d
mscorwks!RuntimeMethodHandle::SerializationInvoke+36
System.RuntimeMethodHandle.SerializationInvoke(System.Object, System.SignatureStruct, System.Runtime.Serialization.SerializationInfo, System.Runtime.Serialization.StreamingContext)
System.Reflection.RuntimeConstructorInfo.SerializationInvoke(System.Object, System.Runtime.Serialization.SerializationInfo, System.Runtime.Serialization.StreamingContext)
System.Runtime.Serialization.ObjectManager.CompleteISerializableObject(System.Object, System.Runtime.Serialization.SerializationInfo, System.Runtime.Serialization.StreamingContext)
System.Runtime.Serialization.ObjectManager.FixupSpecialObject(System.Runtime.Serialization.ObjectHolder)
System.Runtime.Serialization.ObjectManager.DoFixups()
System.Runtime.Serialization.Formatters.Binary.ObjectReader.Deserialize(...)
System.Runtime.Serialization.Formatters.Binary.BinaryFormatter.Deserialize(...)
System.Resources.ResourceReader.DeserializeObject(Int32)
System.Resources.ResourceReader.LoadObjectV2(Int32, System.Resources.ResourceTypeCode ByRef)
System.Resources.ResourceReader.LoadObject(Int32, System.Resources.ResourceTypeCode ByRef)
System.Resources.RuntimeResourceSet.GetObject(System.String, Boolean, Boolean)
System.Resources.RuntimeResourceSet.GetObject(System.String, Boolean)
System.Resources.ResourceManager.GetObject(System.String, System.Globalization.CultureInfo, Boolean)
System.Resources.ResourceManager.GetObject(System.String, System.Globalization.CultureInfo)
LeakControl.Properties.Resources.get_SomePicture()
LeakControl.LeakControlTest.InitializeComponent()
mscorwks!CallDescrWorker+33
...
This call stack sample tells us that 11 seconds in to the tracking this stack allocated 5,49 MB in the GdiPlus!GpMemoryBitmap::AllocBitmapData which is extremely interesting in this case since this method was the one that allocated the 192,26 MB according to the summary.
Looking a bit further down the stack we can see that this is done because we load up some picture resource in the InitializeComponent method for the control. Basically this means that this is something that happens every time the control is loaded.
Turns out that the picture it is loading up is pretty large so that is why we see the 5 MB here (my guess though is that this is done on purpose to show the leak faster). Anyways, this begs the question, why is this bitmap not released? If the control goes out of scope GdiPlus should release this memory as part of the destruction of the control.
Debugging with windbg
The next step for me was to load up the dump in windbg to figure out what was up with these controls.
Running !dumpheap -stat I found that there were 36 controls in memory (same amount as the times I had refreshed)
7912d7c0         66         5,884 System.Int32[]
07b9719c         36         6,768 System.Windows.Forms.PictureBox
7911bbd0        289         8,092 System.Security.SecurityElement
07b54664         36         8,208 LeakControl.LeakControlTest
07b5dc08         82         8,604 System.Windows.Forms.PropertyStore+ObjectEntry[]
79120830        226         9,944 System.Reflection.Emit.OpCode
79104368        491        11,784 System.Collections.ArrayList
79109778        289        16,184 System.Reflection.RuntimeMethodInfo
7912d9bc        101        23,448 System.Collections.Hashtable+bucket[]
7912d8f8        862        79,784 System.Object[]
790fd8c4      6,150       357,664 System.String
7912dae8        100    20,847,312 System.Byte[]
Total 13,093 objects, Total size: 21,516,680
So something is obviously keeping these controls alive.
I dumped them all out using !dumpheap -mt 07b54664
0:000> !dumpheap -mt 07b54664
Using our cache to search the heap.
   Address         MT     Size  Gen
...
05300d84 07b54664      228    2 LeakControl.LeakControlTest
05301910 07b54664      228    2 LeakControl.LeakControlTest
0530237c 07b54664      228    2 LeakControl.LeakControlTest
05302de8 07b54664      228    2 LeakControl.LeakControlTest
05303854 07b54664      228    2 LeakControl.LeakControlTest
053042c0 07b54664      228    2 LeakControl.LeakControlTest
...
Statistics:
      MT    Count    TotalSize Class Name
07b54664       36        8,208 LeakControl.LeakControlTest
Total 36 objects, Total size: 8,208
And then I picked one at random and ran !gcroot on it to see where it was rooted (i.e. what was holding it alive), and among other things I saw this…
0:000> !gcroot 05302de8
...
DOMAIN(04731890):HANDLE(Strong):78416d0:Root:  053031f8(System.Runtime.Remoting.ServerIdentity)->
  053031e8(System.Runtime.Remoting.ObjectHandle)->
  05302de8(LeakControl.LeakControlTest)
Solution
So it is rooted in a System.Runtime.Remoting.ObjectHandle in a ServerIdentity object, whatever that means ;)
Then I searched for System.Runtime.Remoting.ObjectHandle usercontrol and found this… KB 555916 Memory leak in .NET Managed Usercontrols
I just have to stop here and say WOW!!! I really didn’t have a clue that these types of kb article.
And when I say this type I mean
- Community Solutions Content and
- Really nice debugging summaries
Kudos to Alvin Bruney who wrote the article, love it :)
So anyways, it turns out that the reason these objects (and thus the bitmaps) stick around is because remoting is used to communicate between the IE domain and the domain associated with the security zone of the user control. The remoting lease is set in this case to 5 minutes by default which means that these objects will stick around until the lease is up to avoid having to recreate them for further communication between the domains.
You can lower the lease time but as Alvin mentions in the article that may affect the performance. Typically though it should not be an issue since these types of controls are generally not that memory consuming, but if it is, and needs to be, then lowering the lease time is probably the best option.
Btw, I will try to get the memory lab review done today or tomorrow so we can get on with the next lab which will be a high CPU perf issue.
Laters, Tess
