
.NET Debugging Demos Lab 4: High CPU hang - Walkthrough
Hope you have had a chance to go through the high CPU lab… Some people already commented with the solution in the lab instructions but here are my answers and commentary on the lab.
Some parts of the instructions are removed for brevity - and as usual, my comments are inline
Reproduce the issue
- Start the application and browse to
All Products, this should take about 5 seconds or more depending on what machine you’re on -
Watch the CPU usage in task manager while browsing to this page
- What is the CPU usage like for iisexpress.exe during the processing of this request?
very high, approaching 100%
- What is the CPU usage like for iisexpress.exe during the processing of this request?
Reproduce the issue again and gather the memory dump
Note: Watch the performance counters - specifically the collections - while reproducing
-
Generate load with
.\ToolsAndScripts\tinyget.ps1 -url https://localhost:44350/Products -numTimes 5[System.Runtime] % Time in GC since last GC (%) 36 Allocation Rate (B / 1 sec) 2 266 546 976 CPU Usage (%) 46 Exception Count (Count / 1 sec) 0 GC Heap Size (MB) 219 Gen 0 GC Count (Count / 1 sec) 41 Gen 0 Size (B) 28 191 264 Gen 1 GC Count (Count / 1 sec) 41 Gen 1 Size (B) 12 270 032 Gen 2 GC Count (Count / 1 sec) 41 Gen 2 Size (B) 192 LOH Size (B) 118 228 792 Monitor Lock Contention Count (Count / 1 sec) 0 Number of Active Timers 0 Number of Assemblies Loaded 139 ThreadPool Completed Work Item Count (Count / 1 sec) 2 ThreadPool Queue Length 0 ThreadPool Thread Count 9 Working Set (MB) 309If you look at the counters in Visual Studio - Debug/Performance Profiler/.net counters it looks like this
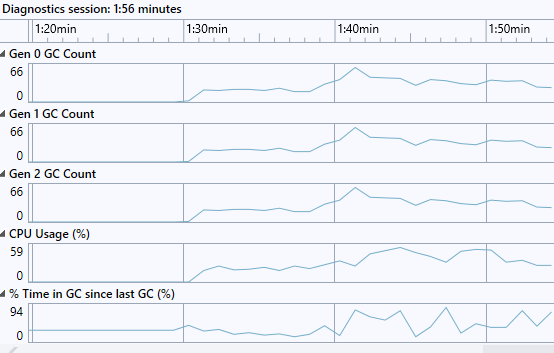
- How high does the CPU Usage (%) get?
Around 50-60 % in my case. This will vary greatly depending on if you are on a single proc or multi processor box since the server GC and workstation GC are optimized for different things. The server GC which runs in the ASP.NET service on multi processor boxes will do more full collections, relocation and compact memory more. The workstation version omits some of this at the expense of higher memory usage.
“% Time in GC since last GC is the percentage of elapsed time that was spent in performing a garbage collection (GC) since the last GC cycle. This counter is usually an indicator of the work done by the Garbage Collector on behalf of the application to collect and compact memory. This counter is updated only at the end of every GC and the counter value reflects the last observed value; its not an average.” in other words this is bound to spike up a bit after a Gen 2 collection but the important part here is that the average time in GC doesn’t end up too high.
- What is the ratio between Gen 0, Gen 1, and Gen 2 GC Count? What should it be in an optimal scenario and why?
Gen 0 collections are basically free. Gen 1 collections (which includes Gen 0 collections) are also pretty cheap since we are still dealing with a low amount of memory that needs to be collected, relocated etc… Gen 2 collections on the other hand can get really really expensive since it deals with the whole .net GC heap. An optimal ratio would be to see 100 Gen 0 collections, per 10 Gen 1 collections and 1 Gen 2 collection, so 100:10:1. In my case the numbers are
40 Gen 0 Collections per second, and the same for Gen 1 and Gen 2, so a ratio of 1:1:1
That means that pretty much every single collection that was done was a Gen 2 collection (since this also triggers a 1 and 0 collection) which is really bad since it means that we take no advantage of having a generational GC, we basically scavenge through all memory all the time.
-
What can cause a ratio like this?
Generally two things cause this type of ratio. Either the allocation pattern is such that pretty much all your allocations are for large objects so the large object heap segments get exhausted all the time or you constantly call GC.Collect directly or through something like GC.GetTotalMemory(true).
- How high does the CPU Usage (%) get?
-
Reproduce the issue again
-
When the CPU usage is high, press enter in the
procdump/dotnet-dumpwindow to get the dump - alternatively you can also right-click in task manager to generate a memory dump.
Verify that you took the dump at the right time
-
Run
!threadpoolto see the CPU usage of the system to make sure that you got the dump at the right time0:000> !threadpool CPU utilization: 81% Worker Thread: Total: 7 Running: 6 Idle: 1 MaxLimit: 32767 MinLimit: 8 Work Request in Queue: 0 -------------------------------------- Number of Timers: 0 -------------------------------------- Completion Port Thread:Total: 1 Free: 1 MaxFree: 16 CurrentLimit: 1 MaxLimit: 1000 MinLimit: 8- What is the CPU Utilization?
81%
- How does the CPU Utilization shown here correlate to the CPU usage of the process?
It doesn’t really correlate - a couple of things to note here… 1. the CPU usage shown here is for the whole system so it will not correlate to the CPU usage of the process, but if you’re running at high CPU typically you are taking most of the CPU. 2. 81% is a very special number. At 80% the threadpool will stop creating new threadpool threads, so when the process is in the middle of a garbage collection, the threadpool will artificially assign CPU usage 81% to stop new threads. In other words, if you see 81% you’re likely in a GC but you can’t say anything about the CPU usage.
- What is the CPU Utilization?
Determine which threads have been consuming most of the CPU time
- Run .time to see the uptime and CPU
User timeof the process -
Run
!runawayto see theUser Mode Timefor all the threads0:000> .time Debug session time: Wed Feb 3 13:29:25.000 2021 (UTC + 1:00) System Uptime: 0 days 5:35:05.910 Process Uptime: 0 days 0:44:51.000 Kernel time: 0 days 0:00:58.000 User time: 0 days 0:02:12.000 0:000> !runaway User Mode Time Thread Time 39:26d0 0 days 0:00:08.906 38:53a4 0 days 0:00:08.796 37:3780 0 days 0:00:08.609 40:69e0 0 days 0:00:08.250 42:63e8 0 days 0:00:08.187 41:6e9c 0 days 0:00:07.562 43:40bc 0 days 0:00:07.546 44:6ec0 0 days 0:00:07.437 45:6974 0 days 0:00:01.625 ...- From
!runawaywhich threads are consuming most of the CPU?Threads 39 through 44
- How much user mode CPU time was consumed by the process in total? (from .time)
approx 64s out of the 2 mins of user mode time was used by these threads
Note: Looking at
!runawayoutput can be a bit tricky for multiple reasons.- First off, on a multi processor machine you have to remember that the user mode time (i.e. clock cycles spent in user mode code) is CPU time spent on all processors, therefore the user mode time may add up to more than elapsed time (process uptime).
- Secondly, the
!runawayoutput shows the total user mode time spent on that thread since it was started. In asp.net for example a thread may be reused for multiple requests so a high user mode time on a thread does not necessarily mean that the requests running on that thread is a big CPU consumer. - And finally, some threads like the GC threads (in multi processor, serverGC processes) stay alive for the duration of the process, so they have a higher chance of accumulating a lot of user mode time than worker threads, therefore it is really more interesting to look at two consecutive dumps and compare the differences in user mode time.
- From
-
Pick the threads that have the highest user mode time and look at their stacks
 ~#s         # set thread context, pick a thread number from !runaway
 kb 2000     # look at the native stack
 !clrstack   # look at the .net stack
0:039> k # Child-SP RetAddr Call Site 00 00000031`fb5ff258 00007fff`9a1aa34e ntdll!NtWaitForSingleObject+0x14 01 00000031`fb5ff260 00007fff`0b595db8 KERNELBASE!WaitForSingleObjectEx+0x8e 02 (Inline Function) --------`-------- coreclr!CLREventWaitHelper2+0x6 03 00000031`fb5ff300 00007fff`0b81b154 coreclr!CLREventWaitHelper+0x20 04 (Inline Function) --------`-------- coreclr!CLREventBase::WaitEx+0x10 05 (Inline Function) --------`-------- coreclr!CLREventBase::Wait+0x10 06 (Inline Function) --------`-------- coreclr!GCEvent::Impl::Wait+0x17 07 (Inline Function) --------`-------- coreclr!GCEvent::Wait+0x17 08 00000031`fb5ff360 00007fff`0b6477f4 coreclr!SVR::gc_heap::bgc_thread_function+0x94 09 00000031`fb5ff3c0 00007fff`0b62335a coreclr!<lambda_d75637c55c295607723a3ad666cdddee>::operator()+0x7c 0a 00000031`fb5ff3f0 00007fff`9b377034 coreclr!Thread::intermediateThreadProc+0x8a 0b 00000031`fb5ffb30 00007fff`9c7bd0d1 kernel32!BaseThreadInitThunk+0x14 0c 00000031`fb5ffb60 00000000`00000000 ntdll!RtlUserThreadStart+0x21 0:039> !clrstack OS Thread Id: 0x26d0 (39) Child SP IP Call Site- What are they doing? Can you make an assumption based on this as to what is causing the high CPU usage?
This looks like a GC thread (on a multi processor machine we have one per processor which correlates well with 8) so it looks like we’re spending most of our time in garbage collection.
- What are they doing? Can you make an assumption based on this as to what is causing the high CPU usage?
-
[Only on multi-proc machines since they have dedicated GC threads]. Sum up the user mode time for the GC threads in
!runawayand divide this by total user mode time from.time.- How much of the total user mode time is spent by the GC threads?
50%
- How much of the total user mode time is spent by the GC threads?
Look at the memory dump to figure out what caused the high CPU in GC
-
Run
~* kb 2000to get all native stacks and search for the thread that triggered the GC (coreclr!SVR::GCHeap::GarbageCollectGeneration)0:052> k # Child-SP RetAddr Call Site 00 00000031`8837d8e8 00007fff`9a1aa34e ntdll!NtWaitForSingleObject+0x14 01 00000031`8837d8f0 00007fff`0b595db8 KERNELBASE!WaitForSingleObjectEx+0x8e 02 (Inline Function) --------`-------- coreclr!CLREventWaitHelper2+0x6 03 00000031`8837d990 00007fff`0b83bce0 coreclr!CLREventWaitHelper+0x20 04 (Inline Function) --------`-------- coreclr!CLREventBase::WaitEx+0x41 05 (Inline Function) --------`-------- coreclr!CLREventBase::Wait+0x41 06 (Inline Function) --------`-------- coreclr!GCEvent::Impl::Wait+0x41 07 (Inline Function) --------`-------- coreclr!GCEvent::Wait+0x41 08 00000031`8837d9f0 00007fff`0b811239 coreclr!SVR::gc_heap::wait_for_gc_done+0xc0 09 00000031`8837da20 00007fff`0b839fea coreclr!SVR::GCHeap::GarbageCollectGeneration+0x2c9 0a 00000031`8837da70 00007fff`0b6bd753 coreclr!SVR::gc_heap::trigger_gc_for_alloc+0x22 0b 00000031`8837dab0 00007fff`0b5df95b coreclr!SVR::gc_heap::try_allocate_more_space+0xddca3 0c 00000031`8837db20 00007fff`0b62e6c4 coreclr!SVR::gc_heap::allocate_more_space+0x5b 0d 00000031`8837dbb0 00007fff`0b6bd57c coreclr!SVR::gc_heap::allocate_large_object+0x64 0e 00000031`8837dc20 00007fff`0b54c9e5 coreclr!SVR::GCHeap::Alloc+0xdddac 0f (Inline Function) --------`-------- coreclr!Alloc+0x12f 10 00000031`8837dc70 00007fff`0b5fd302 coreclr!AllocateString+0x195 11 00000031`8837dd20 00007ffe`ac4d9a34 coreclr!FramedAllocateString+0x82 12 00000031`8837de70 00007ffe`ac4d480b 0x00007ffe`ac4d9a34 ... 0:052> !clrstack OS Thread Id: 0x56b8 (52) Child SP IP Call Site 000000318837DD78 00007fff9c80c034 [HelperMethodFrame: 000000318837dd78] 000000318837DE70 00007ffeac4d9a34 System.String.Concat(System.String[]) 000000318837DEE0 00007ffeac4d480b BuggyBits.Controllers.ProductsController.Index() 000000318837DFE0 00007ffeac1e20fd SOS Warning: Loading symbols for dynamic assemblies is not yet supported DynamicClass.lambda_method(System.Runtime.CompilerServices.Closure, System.Object, System.Object[])- Why was a GC triggered?
We were trying to allocate a large object (
gc_heap::allocate_large_object) and in doing so we needed more space and that triggered the garbage collection. - What type of object was it allocating?
Based on the managed stack it looks like we are allocating a string.
- What is the thread doing?
Concatenating strings in the ProductsController.
- Could this be causing the bad Gen 0, Gen 1, Gen 2 ratio? Why?
Concatenating large strings is a well known cause for high CPU in GC. The reason for this is explained in a lot more detail in this article so I won’t go through the reasons in depth here, but basically what it comes down to is that when you do something like str = str + str2 in a loop you will generate new strings rather than expanding str because strings are immutable. If the loop goes on for a while and the strings are big you will constantly create new strings where one is just slightly bigger than the previous and this causes the LOH segments to be exhausted frequently, which in turn cause a lot of full GCs and high CPU in GC.
- Why was a GC triggered?
-
Find out what is on the large object heap
Note: if you unfortunate you may have caught the GC in the plan or relocate phase in which case the !dumpheap output may not be correct. If that is the case try to make do with what you get from the stacks and !dumpheap -min 85000)
!dumpheap -min 0n850000:052> !dumpheap -type System.String -min 0n85000 Address MT Size 000001d8911938a8 00007ffeabba1e18 495176 000001d89120c710 00007ffeabba1e18 495322 000001d891285610 00007ffeabba1e18 539122 000001d891309028 00007ffeabba1e18 539560 000001d891ad0230 00007ffeabba1e18 514448 000001d891b4dbe0 00007ffeabba1e18 537662 000001d891bd1040 00007ffeabba1e18 514594 000001d891c4ea88 00007ffeabba1e18 538246 000001d8a11d10a8 00007ffeabba1e18 578688 000001d8a125e548 00007ffeabba1e18 538830 000001d8a12e1e38 00007ffeabba1e18 515032 000001d8a135fa30 00007ffeabba1e18 515178 000001d8a13dd6c0 00007ffeabba1e18 515324 000001d8a145b3e0 00007ffeabba1e18 515470- What is on the large object heap?
Mostly strings
- Is there any pattern in the sizes of the strings?
They don’t seem to be of the same size but very similar
- What is on the large object heap?
-
Dump out a few of the strings to see the contents
!do <address of string>0:052> !DumpObj /d 000001d901a83c18 Name: System.String MethodTable: 00007ffeabba1e18 EEClass: 00007ffeabb92150 Size: 538100(0x835f4) bytes File: C:\Program Files\dotnet\shared\Microsoft.NETCore.App\3.1.11\System.Private.CoreLib.dll String: Fields: MT Field Offset Type VT Attr Value Name 00007ffeabaeb1f0 4000242 8 System.Int32 1 instance 269039 _stringLength 00007ffeabae8008 4000243 c System.Char 1 instance 3c _firstChar 00007ffeabba1e18 4000244 110 System.String 0 static 000001d591191360 Empty 0:052> du 000001d901a83c18+0xc 000001d9`01a83c24 "<tr><th>Product Name</th><th>Des" 000001d9`01a83c64 "cription</th><th>Price</th></tr>" 000001d9`01a83ca4 "<tr><td>Product0</td><td>Descrip" 000001d9`01a83ce4 "tion for product0</td><td>$100</" 000001d9`01a83d24 "td><tr><td>Product1</td><td>Desc" 000001d9`01a83d64 "ription for product1</td><td>$10" 000001d9`01a83da4 "0</td><tr><td>Product2</td><td>D" 000001d9`01a83de4 "escription for product2</td><td>" 000001d9`01a83e24 "$100</td><tr><td>Product3</td><t" 000001d9`01a83e64 "d>Description for product3</td><" 000001d9`01a83ea4 "td>$100</td><tr><td>Product4</td" 000001d9`01a83ee4 "><td>Description for product4</t"- Based on the stacks, the knowledge of the collection ratios and the string contents, can you determine what went wrong. You might want to do some internet searches on some of the calls on the stacks if you don’t know the answer immediately.
Looks like the ProductsController is concatenating large string tables which is causing the high CPU
- Based on the stacks, the knowledge of the collection ratios and the string contents, can you determine what went wrong. You might want to do some internet searches on some of the calls on the stacks if you don’t know the answer immediately.
Verify your assumption in the code and modify the code to resolve the issue
-
Look at the code for the function you identified
- What line of code is causing the problem?
- How do you resolve it? Why does this resolve the problem?
Use a StringBuilder and append data rather than concatenating strings. The reason this resolves the issue is because the string builder has a buffer that it fills up when you append so it fills up the existing buffer and doesn’t have to create a new one all the time. When it needs to expand the buffer it doubles it so the amount of times the app has to make new allocations on the LOH is decreased by a factor of 100 or 1000 in this case. If you change it to use a string builder instead you will see what I mean… the CPU usage will drop, the execution time is vastly different and if you look at the number of GCs that occur you will notice that instead of making around 5000 or so garbage collections we are talking about less than 10 full GCs.
Laters, Tess
