
.NET Debugging Demos Lab 6: Memory Leak - Walkthrough
Since it took me so long to get Lab 6 out the door i’ll post the review right away… After this we only have one memory leak lab to go before you have gone through the whole lab set.
Previous labs and setup instructions
If you are new to the debugging labs, here you can find information on how to set up the labs as well as links to the previous labs in the series.
- Information and setup instructions
- Lab 1: Hang
- Lab 2: Crash
- Lab 3: Memory
- Lab 4: High CPU hang
- Lab 5: Crash
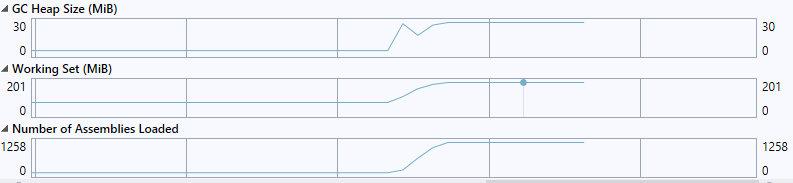
Review the performance counters to figure out what we are leaking
-
Compare the
Working SettoGC Heap Size- Do the numbers seem to match or do they diverge? Based on this, can you tell if the issue we are facing is a virtual bytes leak, a native leak or a .NET leak?
The memory usage on the GC heap goes up, but only by very little - so it doesn’t seem like a .net leak
- Do the numbers seem to match or do they diverge? Based on this, can you tell if the issue we are facing is a virtual bytes leak, a native leak or a .NET leak?
-
Look at the
Number of Assemblies Loadedcounter- Should this counter stay flat or is it ok for this counter to increase like this? What does it mean?
The current assemblies counter tells us how many .net assemblies are loaded in the process. Typically you would see this go up at the beginning of a process or right after an application/appdomain restart since assemblies are loaded at that point. After this it should stay relatively flat. In this case it is constantly increasing which means that we keep loading up new assemblies during the lifetime of the process, and at a pretty steady rate. Since assemblies can not be unloaded unless the application domain is unloaded the memory used for loading these assemblies will not be returned.
- Should this counter stay flat or is it ok for this counter to increase like this? What does it mean?
Debug the memory dump
If there is a big discrepancy between Working Set and GC Heap Size, and they don’t seem to follow each other, we either have a native leak which means that we have a native component that is leaking (in which case debug diag would be the next step), or we have an assembly leak.
-
Open the memory dump, load up the symbols and load sos.dll (see information and setup instructions for more info)
- What is the size of the memory dump (on disk)?
Around 460 MB
- What is the size of the memory dump (on disk)?
-
Run
!eeheap -gcand!dumpheap -stat0:000> !eeheap -gc Number of GC Heaps: 8 ------------------------------ Heap 0 (0000024F042494A0) generation 0 starts at 0x0000024F04826E98 generation 1 starts at 0x0000024F047FBAA8 generation 2 starts at 0x0000024F04761000 ephemeral segment allocation context: none segment begin allocated size 0000024F04760000 0000024F04761000 0000024F04964EB0 0x203eb0(2113200) Large object heap starts at 0x0000025304761000 segment begin allocated size 0000025304760000 0000025304761000 0000025304767CD8 0x6cd8(27864) Heap Size: Size: 0x20ab88 (2141064) bytes. ------------------------------ Heap 1 (0000024F042706A0) generation 0 starts at 0x0000024F847DCDB8 generation 1 starts at 0x0000024F847B6460 generation 2 starts at 0x0000024F84761000 ephemeral segment allocation context: none segment begin allocated size 0000024F84760000 0000024F84761000 0000024F849CCE68 0x26be68(2539112) Large object heap starts at 0x0000025314761000 segment begin allocated size 0000025314760000 0000025314761000 0000025314766048 0x5048(20552) Heap Size: Size: 0x270eb0 (2559664) bytes. ------------------------------ ... ------------------------------ Heap 7 (00000253901AEDB0) generation 0 starts at 0x00000252847BCD60 generation 1 starts at 0x0000025284786618 generation 2 starts at 0x0000025284761000 ephemeral segment allocation context: none segment begin allocated size 0000025284760000 0000025284761000 0000025284906D78 0x1a5d78(1727864) Large object heap starts at 0x0000025374761000 segment begin allocated size 0000025374760000 0000025374761000 0000025374761018 0x18(24) Heap Size: Size: 0x1a5d90 (1727888) bytes. ------------------------------ GC Heap Size: Size: 0x11a7ff8 (18513912) bytes.- What is the size of the .NET heap according to
!eeheap -gc, why is it different fromGC Heap Size?Around 18 MB - The GC heap counter doesn’t include
Freeobjects
We saw from performance monitor that we appeared to be leaking assemblies, so the next step is to determine where these assemblies are created and why we are leaking them.
- What is the size of the .NET heap according to
-
Run
!dumpdomainto look at the assemblies loaded in the process- Which domain has most assemblies loaded? Note: this question makes more sense on a server where you have multiple sites running
Domain 1 - the only non-system domain. On a server it would probably be the one serving the Buggy Bits app
- Are these dynamic assemblies or assemblies loaded from disk? (is there a path associated with them)
Dynamic - so something in the code is generating them
- Which domain has most assemblies loaded? Note: this question makes more sense on a server where you have multiple sites running
-
Dump the module contents using
!dumpmodule <moduleaddress>where module address is the address given right after Module Name on one or a few of the dynamic assemblies. eg. in the example below you would run!dumpmodule 00007ffcfe532d58Assembly: 0000025392f4b4f0 (Dynamic) [] ClassLoader: 000002539340E710 Module Name 00007ffcfe532d58 Dynamic Module -
Run
dc <MetaDataStart> <MetaDataEnd>to dump out the metadata for the module and find out what is implemented in this dynamic assembly. eg. in the example below you would run dc 114d09e4 114d09e4+0n4184Note: We use the start address + 0n4184 because the metadata is 4148 bytes and the 0n stands for decimal
 0:000> !dumpmodule 11b7e900
 Name: gyq9ceq2, Version=0.0.0.0, Culture=neutral, PublicKeyToken=null
 Attributes: PEFile
 Assembly: 158770d0
 LoaderHeap: 00000000
 TypeDefToMethodTableMap: 16e2a2c4
 TypeRefToMethodTableMap: 16e2a2dc
 MethodDefToDescMap: 16e2a33c
 FieldDefToDescMap: 16e2a3a8
 MemberRefToDescMap: 16e2a3d4
 FileReferencesMap: 16e2a4c4
 AssemblyReferencesMap: 16e2a4c8
 MetaData start address: 114d09e4 (4184 bytes)
Note: If your assembly does not show MetaData start address - you have to take a bit of a leap with me and find out from the raw memory where the metadata starts - the example below is for a module at the address
00007ffcfe532d580:000> dp 00007ffcfe532d58 00007ffc`fe532d58 00007ffd`5c570f88 00000253`93187ffa 00007ffc`fe532d68 00000253`92f4b470 00000000`00000000 00007ffc`fe532d78 00000002`00200831 00000000`00000000 00007ffc`fe532d88 00000253`92f4b4f0 00000000`26000000 00007ffc`fe532d98 ffffffff`ffffffff 00000000`ffffffff 00007ffc`fe532da8 00000000`00000000 00000000`00000000 00007ffc`fe532db8 00000000`020007d0 00000000`c0000000 00007ffc`fe532dc8 ffffffff`ffffffff 00000000`ffffffffTake the 2nd address
0000025393187ffa- this is where the metadata is stored, and print out the contents from there and 1000 bytes on0:000> dc 00000253`93187ffa 00000253`93187ffa+0n1000 00000253`93187ffa 7263694d 666f736f 65472e74 6172656e Microsoft.Genera 00000253`9318800a 43646574 0065646f 45666552 5f74696d tedCode.RefEmit_ 00000253`9318801a 654d6e49 79726f6d 696e614d 74736566 InMemoryManifest 00000253`9318802a 75646f4d 5300656c 65747379 72502e6d Module.System.Pr 00000253`9318803a 74617669 6f432e65 694c6572 79530062 ivate.CoreLib.Sy 00000253`9318804a 6d657473 6665522e 7463656c 006e6f69 stem.Reflection. 00000253`9318805a 65737341 796c626d 73726556 416e6f69 AssemblyVersionA 00000253`9318806a 69727474 65747562 74632e00 5300726f ttribute..ctor.S 00000253`9318807a 65747379 72502e6d 74617669 6d582e65 ystem.Private.Xm 00000253`9318808a 7953006c 6d657473 6c6d582e 7265532e l.System.Xml.Ser 00000253`9318809a 696c6169 6974617a 58006e6f 65536c6d ialization.XmlSe 00000253`931880aa 6c616972 74617a69 576e6f69 65746972 rializationWrite 00000253`931880ba 6d580072 7265536c 696c6169 6974617a r.XmlSerializati 00000253`931880ca 72576e6f 72657469 646f7250 44746375 onWriterProductD 00000253`931880da 69617465 4d00736c 6f726369 74666f73 etails.Microsoft 00000253`931880ea 6c6d582e 7265532e 696c6169 6974617a .Xml.Serializati 00000253`931880fa 472e6e6f 72656e65 64657461 65737341 on.GeneratedAsse 00000253`9318810a 796c626d 69725700 5f346574 646f7250 mbly.Write4_Prod 00000253`9318811a 44746375 69617465 6f00736c 69725700 uctDetails.o.Wri 00000253`9318812a 74536574 44747261 6d75636f 00746e65 teStartDocument. 00000253`9318813a 74697257 6c754e65 6761546c 6574694c WriteNullTagLite ...- What type of assembly was this? What is it used for? How is it generated?
Looks like it is an
Xml.Serialization.GeneratedAssemblyforProductDetailsso something used for xml serialization
- What type of assembly was this? What is it used for? How is it generated?
Putting it all together and determining the cause of the assembly leak
If we look at the documentation for XmlSerializer we get the following information about dynamically generated assemblies related to XmlSerialization
Dynamically Generated Assemblies To increase performance, the XML serialization infrastructure dynamically generates assemblies to serialize and deserialize specified types. The infrastructure finds and reuses those assemblies. This behavior occurs only when using the following constructors:
- XmlSerializer..::.XmlSerializer(Type)
- XmlSerializer..::.XmlSerializer(Type, String)
If you use any of the other constructors, multiple versions of the same assembly are generated and never unloaded, which results in a memory leak and poor performance. The easiest solution is to use one of the previously mentioned two constructors. Otherwise, you must cache the assemblies in a Hashtable…
From this, and the fact that our performance logs and dump shows that we are continuously generating new XML serialization assemblies we can conclude that it is very likely that we are not using one of the standard constructors. Search the project code for new XmlSerializer or use reflector like in this example to determine where we are generating these dynamic assemblies.
-
What method / line of code is causing the problem?
  public ProductDetails GetProductInfo(string productName)
  {
      ProductDetails product = new ProductDetails();
      ShippingInfo shipping = new ShippingInfo();
      product.ProductName = productName;
      shipping.Distributor = "Buggy Bits";
      shipping.DaysToShip = 5;
      product.ShippingInfo = shipping;

      Type[] extraTypes = new Type[1];
      extraTypes[0] = typeof(ShippingInfo);

      MemoryStream stream = new MemoryStream();
      --> XmlSerializer serializer = new XmlSerializer(typeof(ProductDetails), extraTypes);
      serializer.Serialize(stream, product);

      // TODO: save off the data to an xml file or pass it as a string somewhere

      stream.Close();

      return product;
  }
The XmlSerializer line is the one causing the issue, specifically because we are using the non-default constructor with extraTypes, which cause .net not to cache and reuse the dynamic assembly.
Have fun, Tess
