
DebugDiag 1.1 or Windbg, which one should I use? and how do I gather memory dumps
If you have read any of my posts you have probably noticed that I am very partial to windbg and the debugging tools for windows. I often get friendly nudges from the developers of debugdiag when I suggest using adplus and windbg on internal discussion lists, and to be fair I have to beat on the drum a bit for debug diag as well.
My answer to the question “Should I use DebugDiag 1.1 or Windbg” is both… it just depends on the scenario. I often lean towards windbg but to a large extent that is because that is what I use all the time, so in many cases where both fit the bill equally well I simply haven’t invested the time to see how it can be done with debug diag and therefore I suggest what I know works.
Before I start the comparison, I just want to mention that dumps created with debug diag can be analysed in windbg and vice versa. They use the same APIs and create the same types of memory dumps. Where they differ largely is how you configure them to gather these dumps and logs, how you analyse them in the different tools and by the fact that DebugDiag has a nice feature that allows you to monitor memory leaks in the process.
I personally use debug diag to gather dumps for native memory leaks, and I use it to analyse asp and other native issues in conjunction with windbg. For everything else I use windbg because a) I like the logs that adplus creates and b) I like the fact that I have full control and can execute any commands I want.
Having said this I know that it is much easier to gather dumps in debug diag, and it has excellent automated analysis features which is great if you don’t do post-mortem debugging on a daily bases, so I would strongly recommend trying both and making up your own mind about which one fits your style best.
Where do you get the tools?
Debug diag can be [downloaded and installed here](https://www.microsoft.com/en-us/download/details.aspx?id=58210#:~:text=The%20Debug%20Diagnostic%20Tool%20(DebugDiag,in%20any%20user%2Dmode%20process.).
Windbg comes with the debugging tools for windows which you can download in the Microsoft Store or with the Debugging Tools For Windows.
Installation on production machines
Windbg
Windbg and the debugging tools for windows can also be installed on the production machine through the msi downloaded above. If this is not allowed you can install the package on a developer machine and copy the “debugging tools for windows” folder to the production machine so no installation necessary. The installation package creates a few registry keys etc. that are used for versioning control, saving workspaces etc. but they are not necessary to run the tools.
Windbg comes with a vbscript file called adplus.vbs that you use to automate taking memory dumps.
Debug diag
Debug diag needs to be installed on the production machine through the msi downloaded above. This can sometimes prove to be a problem in cases where you are not allowed to install external tools on the server.
Symbol setup
Both windbg and debugdiag will use the _NT_SYMBOL_PATH environment variable.
Windbg
If you don’t have this set you can set the symbol path in windbg through the UI file/symbol file path… or using the command .sympath. In adplus config files you would set the symbol path by adding .sympath "path" to the <PreCommands> section.
Note: you only need to set up symbols if you need to show call stacks or set breakpoints on certain functions so for most cases you will not need to set up a symbol path for adplus config files.
Debug diag
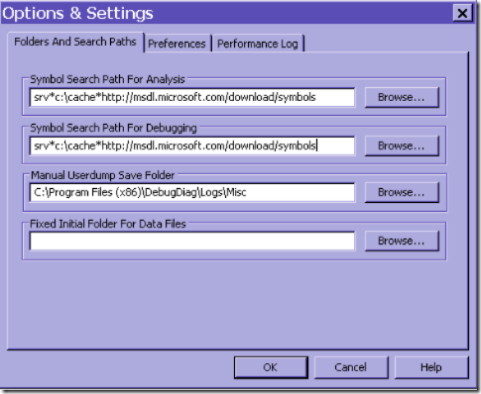
In debug diag you have two options for symbol paths (you set this up in the UI through tools/options and settings)
The “Symbol Search Path” for Analysis is used when you run a dump through an analysis script. The “Symbol Search Path for Debugging” is used when you gather dumps, set up breakpoints and for leak tracking. It is very important that you set up a proper symbol path if you do leak tracking in order to get correct data.
I am not going to go into what symbols are and how they are used in any more depth as this is not what this post is about, but if you are interested, have a look at this post
Gathering memory dumps for hangs
Windbg
For windbg/adplus you would open a command prompt, browse to the debugging tools for windows folder and run
adplus -hang -pn w3wp.exe
to get a memory dump of all w3wp.exe processes
adplus -hang -p 1244
to get a memory dump of the process with PID 1244
adplus -hang -IIS
to get a dump of all IIS related processes like w3wp.exe, inetinfo.exe, aspnet_wp.exe and dllhost.exe
You can also get a memory dump directly from windbg if you attach to the process and run .dump /ma "path to store dump"
Debug diag
copied from the debug diag instructions
To debug a process hang, use one of the following:
Create a hang rule. (this feature is available only for IIS processes) . The hang monitoring feature for IIS processes is designed to troubleshoot performance issues when users browse to pages in a web application and the pages take a long time to respond, or do not respond at all. During the hang rule creation wizard, specify the target processes to dump and a URL to be monitored along with a “Ping” interval and a response “timeout” The tools will send a request to the server at the configured intervals, and if the server does not respond before the configured timeout, a memory dump will be generated for the processes specified process(es). Create a manual memory dump during the slow or hang state by right-clicking the process name in the processes view and choosing the “Create Full Userdump” option.
Gathering memory dumps for crashes
Windbg
For windbg/adplus you would open a command prompt, browse to the debugging tools for windows folder and run
adplus -crash -pn w3wp.exe
to get a memory dump of all w3wp.exe processes when a crash occurs
adplus -crash -p 1244
to get a memory dump of the process with PID 1244
adplus -crash -IIS
to get a dump of all IIS related processes like w3wp.exe, inetinfo.exe, aspnet_wp.exe and dllhost.exe
Debug diag
copied from the debug diag instructions
A process crash is usually indicative of an unhandled exception occurring in a process or code running in a process that actively terminates the process. To debug a process crash, start by creating a crash rule against the process(s) in question. Similar to previous debuggers, DebugDiag will attach to a specific process (s) and will monitor the process for multiple types of exceptions or any custom breakpoints that cause the process(s) to terminate unexpectedly. When the crash occurs, a full memory dump file will be created, in the directory specified when setting up the crash rule.
Analyzing hangs and crashes
Debugdiag has some nice automated scripts (under the advanced analysis tab) that go through the dump and identify the most common causes for hangs and crashes.
The analysis produces an HTML page with all the call stacks for the threads, info about http requests etc. and for ASP it also produces the ASP call stack. In addition it gives you information about what it thinks is the problem.
Windbg on the other hand does not have any automated analysis features so you have to manually look at the threads, stacks and other data to figure out what happened.
Why would anyone in their right mind use windbg for hang analysis then????
- Sometimes you need more information than just the call stack so you need to deep dive in the stacks, parameters, local variables etc.
- Debug diag will not produce managed stacks. It is in the works, and sometimes it will produce managed stacks but not always.
- It takes a while for debugdiag to produce the report, and although this is not an issue for most people (waiting 10 mins for dump analysis), I use windbg in some cases because I can identify most common causes by looking at the stacks faster than running debug diag, and I know that I will need to dive deeper anyways, so it is a matter of effectivity. If you don’t work with post-mortem debugging on a daily bases though debug diag is unbeatable since it analyses the dump for you.
Gathering memory dumps for memory leaks and analyzing the data
If you have a native memory leak you should definitely use leak tracking with debugdiag.
From the debug diag instructions
To debug memory and handle usage, use one of the following:
- Create a leak rule against the process in question. The leak monitoring feature will track memory allocations inside the process. Tracking is implemented by injecting a DLL (leaktrack.dll) into the specified process and monitoring memory allocations over time. When configuring a memory and handle leak rule, you can specify memory dump generation based on time or memory usage.
- Using the “processes” view, right-click the process in question and select the “monitor for leaks” option. When the process has grown to the suspected problem size, manually dump the process by right-clicking on the same process in the processes view and choosing the “Create Full Userdump” option.
Note: Leak tracking needs to be enabled while you are leaking memory, preferably from right after the start of the process in order to get the most out of the data. When you analyze the memory leak you will get information about how much you have allocated and not released while leak tracking was turned on. You will also get sample stacks showing you who allocated this data.
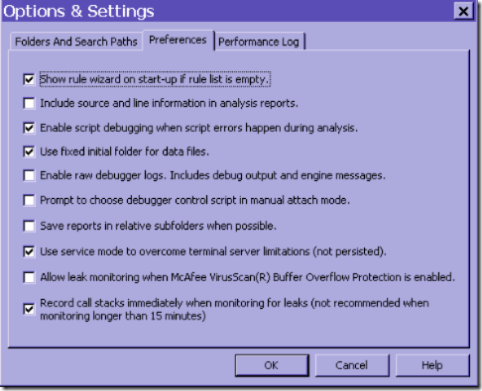
In order to avoid getting info about startup data, leak tracker does not track during the first 15 minutes. You can change this behavior in tools/options and settings by checking the checkbox “Record call stacks immediately when monitoring for leaks”
If you have a managed (.net) memory leak, leak tracking will not be very useful. If you use leak tracking for a .net leak you will simply get a message that mscorwks.dll has allocated most of the memory and that you should follow up with the author of mscorwks.dll which happens to be Microsoft.
The reason you get this is because mscorwks, the core of the CLR will allocate memory in chunks for you to allocate .net objects from. If you are “leaking” .net objects, the GC allocates more heap segments so the in the native world it looks like mscorwks is leaking. In reality you need to go in and look at what is on the heaps to find out why there is so much, preferably with windbg.exe
If you have a memory dump that did not have leak tracking enabled, you can still analyse it using the memory analysis script in debug diag, it will tell you some data like how much is allocated, what heaps they are on etc. but of course it can not give you the call stacks since they were not recorded in the process.
Gathering exception information (.net)
I will write a post shortly on how to gather .net exception information in debug diag. In short, you create a crash rule and set up exception breakpoints.
In windbg you would set up an adplus configuration file, to either log call stacks for all .net exceptions or a specific .net exceptions, or alternatively create dumps for a specific exception depending on your needs. The details on how to set this up can be found here.
Laters y’all, Tess
