
Troubleshooting a performance issue with Failed Request Tracing and appcmd in IIS7
I know I’m a little late in the game, but I decided that after vacation it was finally time for me to install Windows 2008 on my Vista box and play around with some of the IIS 7 features like Failed Request Tracing (known as FRT or FREB) and the appcmd tool.
I wanted to show you an alternative way of troubleshooting Lab 1 (hang scenario) from my Debugging Lab series using Failed Request Tracing and appcmd so here are some things I will go through in this post
- Setting up failed request tracing
- Listing executing requests with appcmd
- Using Page.Trace with failed request tracing
- Setting up different FREB rules and looking at the differences between them
Short notes about failed request tracing
Failed request tracing comes with IIS7. It works both on Vista and Windows 2008 but the output is a little bit different. (I’ll explain later how to make the vista output look like the windows 2008 output).
Failed request tracing allows you to trace requests coming into IIS both at the native level and at the ASP.NET level, and there are a few big differences between failed request tracing and regular ASP.NET tracing.
First off, regular asp.net tracing (@page trace="true" or <trace> in web.config) lets you track things that happen inside the asp.net sub system. You can write to the trace or just look at the time it took to execute certain parts like page_load etc. but the drawbacks are that you can not trace what happens outside (eg. authentication etc.) and you will also have to be at the server when the issue occurs since you will either see the output on the page or the last few request in the trace.axd file. You can of course up the number of requests you trace but if you up it too much you will end up with a memory issue like this one.
The failed request tracing traces are stored as xml files under c:\inetpub\logs\FailedReqLogFiles\W3SVC1 (where W3SVC1 is the id of the site), so if you trace a lot of requests you will not run out of memory, instead the limitation is hard disk space, but the number of traces saved is governed by your FREB settings, by default it is the last 50.
Setting up failed request tracing
To set up failed request tracing in IIS 7 you have to install the feature and enable it.
If you are on Vista, you will also want to change the xsl style sheet for displaying the freb traces so that you get the new Windows 2008 look on the traces. You can download the new freb.xsl from here, and it is further explained here.
Note: When using this freb.xsl you will end up with some warnings on the main page when you look at a failed request trace, saying “Failed To Complete”, you can ignore them, these warnings just mean that the trace contains some incomplete traces (which is normal) where there is no matching start and end tag for a module. In the windows 2008 version of this stylesheet these incomplete traces are simply not shown.
Finally, something else you might want to set up is a trace viewer plugin for IIS7. As mentioned earlier the traces are stored as XML files on your hard drive. If you have a lot of them it can be a little cumbersome to browse through them. This plugin shows the traces in a table format, showing you essential information like the path, request time (last modify date), time taken, status code etc. so it is easy to identify which ones are important to you. I will be using this plugin later in the post.
Using appcmd to list currently executing requests
If you recall Lab 1, we call up Featured Products and it takes 5 seconds to execute. During those 5 seconds it grabs a lock so if we bring up two browsers hitting this page, the first request will take 5 seconds and the next request will take 10 seconds, i.e. the 5 seconds that it waits for the lock and then another 5 seconds to execute what is in the lock.
For the purposes of this demo I use tinyget to hit the page 20 times (10*2),
tinyget -srv:localhost -uri:/BuggyBits/FeaturedProducts.aspx -threads:10 -loop:2
With this prepared in one command window I open up another command window (run as administrator) and browse to c:\windows\system32\inetsrv. Here i execute the command appcmd list requests which lists all the executing request on the server.
I let tinyget run for a few seconds before listing the requests, and to make it more viewable i pipe the output to a text file…
appcmd list requests >> c:\results\requests.txt
The results look like this:
REQUEST "ed0000008000001c" (url:GET /BuggyBits/FeaturedProducts.aspx, time:14562 msec, client:localhost, stage:ExecuteRequestHandler, module:ManagedPipelineHandler)
REQUEST "eb00000080000018" (url:GET /BuggyBits/FeaturedProducts.aspx, time:14562 msec, client:localhost, stage:ExecuteRequestHandler, module:ManagedPipelineHandler)
REQUEST "e600000080000014" (url:GET /BuggyBits/FeaturedProducts.aspx, time:14562 msec, client:localhost, stage:ExecuteRequestHandler, module:ManagedPipelineHandler)
REQUEST "f100000080000018" (url:GET /BuggyBits/FeaturedProducts.aspx, time:14562 msec, client:localhost, stage:ExecuteRequestHandler, module:ManagedPipelineHandler)
REQUEST "ec00000080000018" (url:GET /BuggyBits/FeaturedProducts.aspx, time:14562 msec, client:localhost, stage:ExecuteRequestHandler, module:ManagedPipelineHandler)
REQUEST "e800000080000014" (url:GET /BuggyBits/FeaturedProducts.aspx, time:14562 msec, client:localhost, stage:ExecuteRequestHandler, module:ManagedPipelineHandler)
REQUEST "cd00000180000018" (url:GET /BuggyBits/FeaturedProducts.aspx, time:14547 msec, client:localhost, stage:ExecuteRequestHandler, module:ManagedPipelineHandler)
REQUEST "f000000080000006" (url:GET /BuggyBits/FeaturedProducts.aspx, time:14547 msec, client:localhost, stage:ExecuteRequestHandler, module:ManagedPipelineHandler)
REQUEST "ea00000080000018" (url:GET /BuggyBits/FeaturedProducts.aspx, time:9547 msec, client:localhost, stage:ExecuteRequestHandler, module:ManagedPipelineHandler)
REQUEST "e90000008000001a" (url:GET /BuggyBits/FeaturedProducts.aspx, time:4547 msec, client:localhost, stage:ExecuteRequestHandler, module:ManagedPipelineHandler)
So this lets us know that there are 10 requests for FeaturedProducts.aspx executing, and at this point they have been executing between 4547 msec and 14562 msec. If I were to re-run the command we would see these numbers change.
I really like this appcmd list requests since it gives a good snapshot of what is going on on the server and if the server is running slowly we get a good overview of what is currently executing and how long it has been working on those requests so we can pinpoint “bad” pages. In this case of course I am only executing one particular page, but even still we can see that this page is having severe issues in terms of how long time it takes to process…
Setting up a failed request tracing rule for this page
There are lots of ways to customize what should be traced and what shouldn’t. The major things you can customize are
- The content being traced
- All content (*) - traces any requests that are made, including .css, .jpg etc.
- ASP.NET (*.aspx)
- ASP (*.asp)
- Custom - here you can choose to trace either all jpg request by setting this to *.jpg for example, or a specific page by typing in FeaturedProducts.aspx etc
- Triggers for tracing
- Status codes - produces a trace when a specific status code is found, eg. 500, if you want to trace all requests choose 100-600
- Time taken (in seconds) - produces a trace when a request has taken more than x seconds. Note that the trace is produced as soon as the trigger is met, it doesn’t wait for the request to finish executing.
- Event severity - Produces a trace when you receive a warning, error or critical error
- What the trace should contain
- Here you choose the verbosity of the trace, i.e. if it should only log errors, or warnings, or everything (general) for each sub system
Note: For the triggers, it’s an or condition, so if you set it up for Status codes = 500 and Time Taken = 4 seconds it will produce a trace when the a request has a status code of 500 or when a request takes more than 4 seconds. If a request hits two triggers, it will be triggered for the condition that happens first. (this will become important in a little bit)
For now let’s set up a rule for any requests that take over 10 seconds.
-
In the applications features view of IIS 7, click on the Failed Request Tracing Rules

- Click Add in the Actions pane and choose Custom, and in the custom box type FeaturedProducts.aspx in order to only track the requests for FeaturedProducts.aspx
- In the next step we choose Time Taken and set it to trigger when a request has taken more than 10 seconds.
- In the final step we choose to only trace things in the ASPNET subsystem and leave the Verbosity set to Verbose so we get all the tracing info
We should end up with a rule that looks like this
Looking at the results
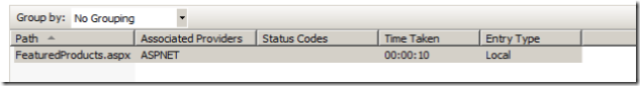
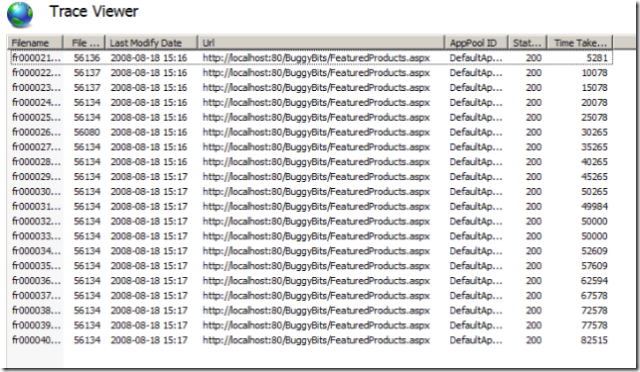
If we rerun the stress test now and look at the Trace Viewer add-in we see a large number of traces, one for each request that has taken over 10 seconds.
We can double-click them to view the details (as I’ll show later) but for now, notice that the Time Taken column shows that the time taken for all of these is around 10 seconds.
We know from our appcmd list requests that these requests often take a lot more time than 10 seconds since we had quite a few that were still executing that had already been running for 14 seconds +. This threw me for a loop for a while until I figured out what the issue was. Since the trigger kicks in after 10 seconds it will write the trace to disk at that point and consider it done. In other words, it does not wait until the request has actually completed.
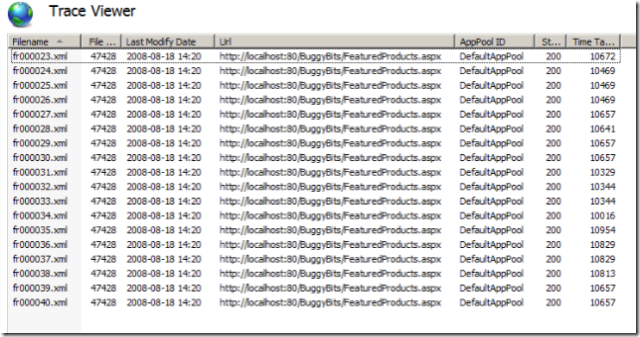
If on the other hand we would have set up a rule that used the status code = 200 (and unchecked the Time Taken box) we would have gotten a trace for each request to FeaturedProducts.aspx but the trace would have contained the complete trace for the request.
When we uncheck the Time Taken box and select the response code 200 we can see the actual Time Taken, and we can see it go up by 5 seconds for each request like we expected.
Looking at a trace
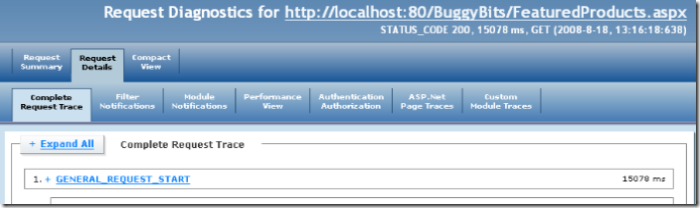
If I double-click on a trace (for example one that has taken 15078 msec) I am greeted with this view…
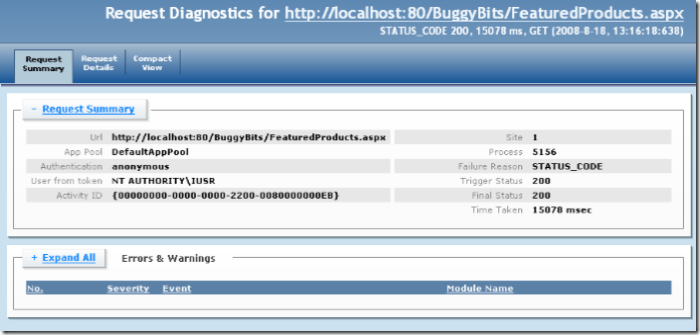
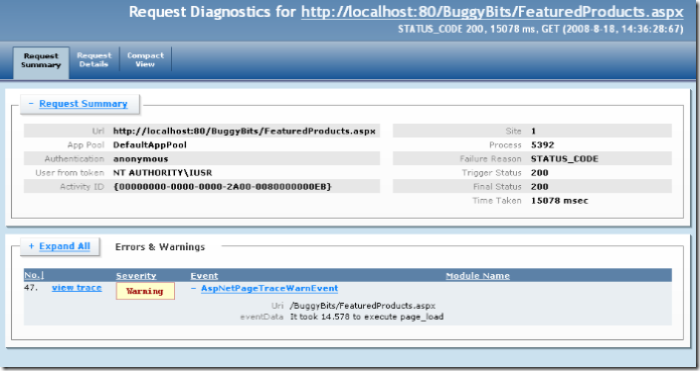
Here we can see what request it is for, the time it started, how long it took, what the authentication method and User was authenticated. In the second column it also tells us the “Failure Reason”, i.e. what rule it triggered on, and in this case it shows us STATUS_CODE because it triggered on the rule Status Code = 200
The Request Details view shows us all traced content by type. I.e. clicking on the “Filter Notifications” tab will only show the traces that fall under Filter Notifications etc.
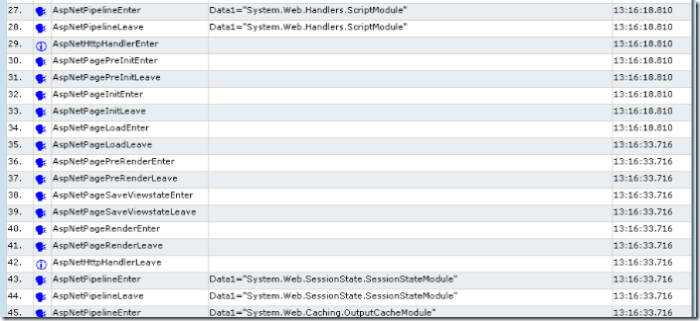
And finally the Compact View shows us all the traces in the order they were recorded, along with the timestamps for each.
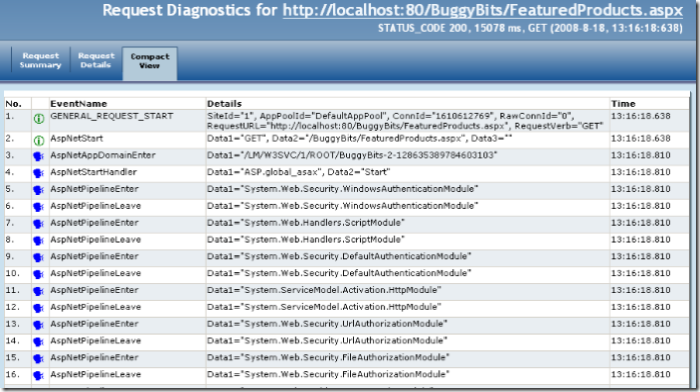
Since I know that my request took 15 seconds, what I am looking for here is a big jump in time that would show me where the 15 seconds were spent, and in the picture below you can see that ASPNetPageLoadEnter was triggered at 13:16:18.810 and the next event AspNetPageLoadLeave wasn’t triggered until 13:16:33.716 so from this we can tell that the offending code is in/or called from Page_Load.
If we look at one of the traces that were taken with TIME_TAKEN we will note in this view that the last trace entered will be AspNetPageLoadEnter so we will essentially get the same information, i.e. that we are spending a lot of time in Page_Load. We just won’t get the trace entries after the offending piece of code.
Getting more specific with asp.net tracing
ASP.NET Trace output will also show up in these traces so I’m adding some tracing to my Page_Load to drill deeper into exactly what is taking time here…
I went ahead and turned on tracing for the application in the web.config file using
<trace enabled="true" pageOutput="false" />
and then I modified my page_load to include some Trace.Write messages and a Trace.Warn message
protected void Page_Load(object sender, EventArgs e)
{
    System.DateTime start = System.DateTime.Now;
    if (!Page.IsPostBack)
    {
        Trace.Write("In the postback method, before the GetFeaturedProducts request");
        DataView dw = new DataView(((DataLayer)Application["DataLayer"]).GetFeaturedProducts());
        dlFeatured.DataSource = dw;
        Trace.Write("Before databinding");
        dlFeatured.DataBind();
        Trace.Write("After databinding");
    }

    System.DateTime end = System.DateTime.Now;
    lblStartTime.Text = start.ToLongTimeString();
    string time = end.Subtract(start).Seconds + "." + end.Subtract(start).Milliseconds;
    lblExecutionTime.Text = time;
    Trace.Warn("It took " + time + " to execute page_load");
}
And then I reran the stress test to get the new results and ended up with the following trace output…
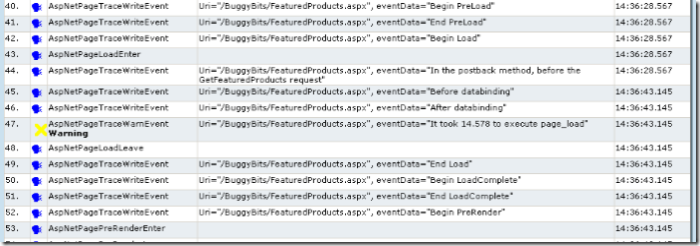
And with this I have now narrowed the issue down to the point that I know that my performance issue lies between the “In the postback method, after the GetFeaturedProducts request” line and before “Before databinding”, i.e. most of the time is used by the call to GetFeaturedProducts…
DataView dw = new DataView(((DataLayer)Application["DataLayer"]).GetFeaturedProducts());
Conclusion
Performance issues can often be very hard to debug and troubleshoot, especially if they are intermittent. You can of course debug performance issues with dumps, but that requires you to be there at the time that the issue occurs which can be a bit of an issue, especially if they occur once in a blue moon, or at very awkward times… or if the process is not “hanging” long enough for you to catch a dump while it is happening. If that is the case, failed request tracing is an excellent way to capture some essential data, especially since you can trigger it to capture data only when an issue occurs.
Having said this, there are still times when you need to debug, especially if the data you collect with tracing is not enough, but even in those cases you can oftentimes gather enough data with tracing to have a good chance of reproducing the issue in a test environment.
Laters, Tess
