
Debugging a .NET crash with rules in Debug Diag
During mine and Micke’s presentation at TechDays this week I showed a demo of setting up rules with Debug Diag to identify the cause of a crash in an ASP.NET application.
Even though debugging might be tricky, setting up rules in Debug Diag is beautifully simple and I personally believe that it would be a good idea for anyone running a web site to have debug diag installed along with a few instructions for the ops personnel on how to set up the rules. Better yet, you can set up the rules in advance and just activate or deactivate them as needed.
Here is a recap of that demo…
Problem description
The application crashes with the following event in the event log
Log Name:           Application
Source:             Application Error
Date:               2009-03-20 11:12:09
Event ID:           1000
Task Category:      (100)
Level:              Error
Keywords:           Classic
User:               N/A
Computer:           MYMACHINE
Description:
Faulting application w3wp.exe, version 7.0.6001.18000, time stamp 0x47919413, faulting module kernel32.dll, version 6.0.6001.18000, time stamp 0x4791a76d, exception code 0xe053534f, fault offset 0x000442eb, process id 0x%9, application start time 0x%10.
So the w3wp.exe process crashed due to a 0xe053534f exception (which happens to be stack overflow, but even if you don’t know that it doesn’t really matter)
Setting up Debug Diag rules and gathering data
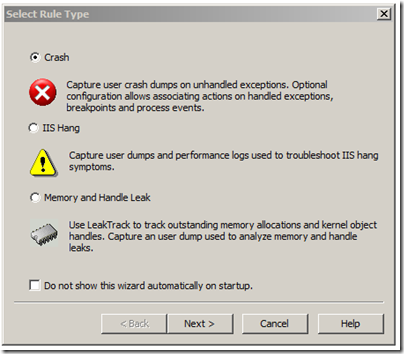
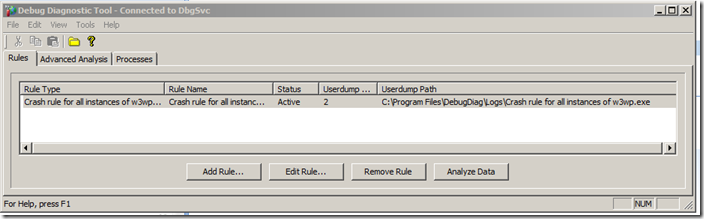
When you open up Debug Diag you are met by the following screen where you can set up different rules.
If you have a potential memory leak or a memory issue, you should choose the memory and handle leak rule. This will inject a dll in the process that will track any allocations or de-allocations that occur while the rule is active. Once you have “leaked” memory you can then get a memory dump with debug diag, and this will now contain info about what stacks etc. allocated the memory that is still in the process.
This works well for native memory issues. For .net memory issues you should be aware that allocations for .NET GC heaps are made my mscorwks, which means that .net memory issues will show up as mscorwks having a potential leak. I would recommend that you read some of my earlier posts on troubleshooting .net memory issues.
The IIS Hang rule is very useful if you have some pages that sometimes take longer than they should. With this rule you can set up triggers to get logs or memory dumps if a page takes longer than x seconds.
If you have an exception you want a dump for or a crash you should use the crash rule and that is what we’ll do now…
The next step is to choose a process that the rule should apply to. Here we can choose either IIS which means that it will apply to all IIS processes like w3wp.exe, dllhost.exe, inetinfo.exe etc.
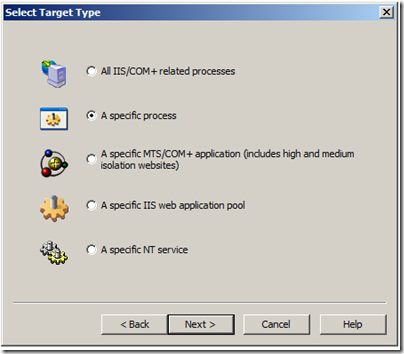
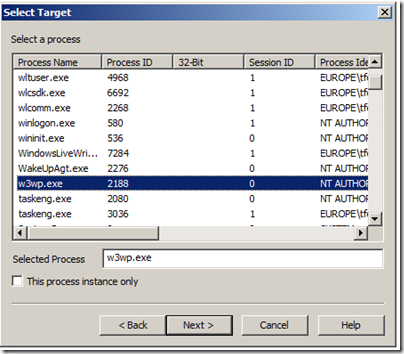
In this case we will only set up a rule for w3wp.exe (the asp.net process). If we just leave it like that, and the process crashes it will reattach the rule next time the process comes up. It will also apply the rule to all w3wp.exe processes if there are multiple on the system. If you only want it to apply to one specific w3wp.exe instance you have to check the checkbox for “This process instance only”.
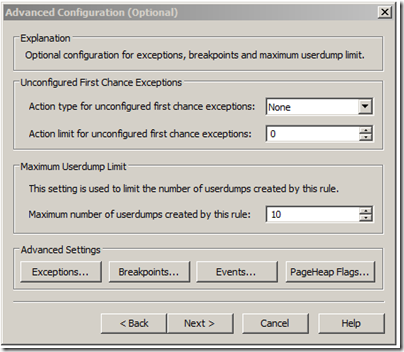
The next window that comes up in the wizard lets you configure what you want to trigger the debug diag action. This can either be just a crash (in which case you just click next). You can also set it up to get dumps or log events on specific exceptions (as we will do), or on breakpoints. The PageHeap Flags option is used if you want to troubleshoot heap corruption issues.
Since we want to trigger a dump when the process gets the 0xe053534f exception, we will click on the Exceptions… button here
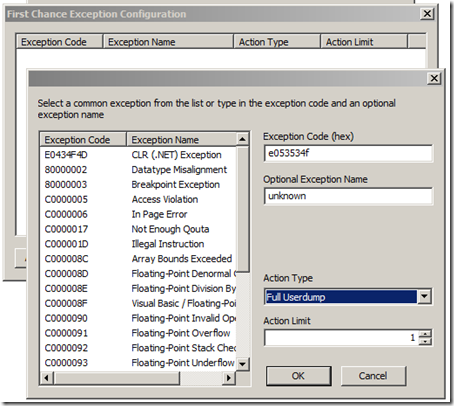
0xe053534f is a native exception so we can just enter it in the box for the exception code. We can optionally give the exception a name (this will just label the dumps that are generated). and for the action type we choose full dump to have it dump on the exception.
Note: You can set an action limit here to avoid that it keeps generating dumps. This is pretty useful if you want to set up a rule for System.NullReferenceException for example, or something else that might happen a lot.
If we would have wanted to dump on a particular .net Exception we would have just chosen the CLR (.NET) Exception from the listbox on the left and we could have then entered the specific exception name (such as System.NullReferenceException)
Now we are ready with the rules and can just click ok, next, next, finish to activate the rule.
Once this is done we can reproduce the issue and debug diag will generate the dump and put it under the <debug diag dir>\logs\crash rule... directory.
Analyzing the data
At this point we can click the Analyze Data button and have debug diag analyze the dump for us. This works extremely well if the issue is purely native. Just a few quick notes about this though…
-
I wouldn’t recommend analyzing it on a production server, so the best thing is to copy the dump to a dev machine, and analyze it (from the advanced analysis tab)
-
You should set up the symbol path under tools/options and settings to
SRV*c:\websymbols*http://msdl.microsoft.com/download/symbols -
If the issue is not purely managed, you may still need to open the dump in windbg
If we analyze it we get this info at the top of the html report
| Error | In w3wp__PID__4000__Date__03_20_2009__Time_10_31_41AM__331__First Chance unknown.dmp the assembly instruction at kernel32!RaiseException+58 in C:\Windows\System32\kernel32.dll from Microsoft Corporation has caused an unknown exception (0xe053534f) on thread 25 This exception originated from mscorwks!ReportStackOverflow+61. |
Review the faulting call stack for thread 25 to determine root cause for the exception. Please follow up with vendor Microsoft Corporation for problem resolution concerning the following file: C:\Windows\Microsoft.NET\Framework\v2.0.50727\mscorwks.dll. |
and thread 25 looks like this:
Thread 25 - System ID 4332
Entry point                 mscorwks!Thread::intermediateThreadProc
Create time                 2009-03-20 10:30:32
Time spent in user mode     0 Days 0:0:0.203
Time spent in kernel mode   0 Days 0:0:0.78


Function                        Arg 1       Arg 2       Arg 3       Source
kernel32!RaiseException+58      e053534f    00000000    00000000
mscorwks!ReportStackOverflow+61 025dc2e0    025dc2e0    044a3db4
mscorwks!Alloc+3b               00000024    00000000    00080000
mscorwks!FastAllocateObject+38  00f69594    4a4521fa    044a3e98
mscorwks!JIT_NewFast+9e         3149ec3b    88cb775e    3149ec3b
0x02b20794                      1d51bcd8    3149ec3b    88cb775e
0x02b207e8                      1d51bcd8    3149ec3b    88cb775e
0x02b207e8                      1d51bcd8    3149ec3b    88cb775e
0x02b207e8                      1d51bcd8    3149ec3b    88cb775e
0x02b207e8                      1d51bcd8    3149ec3b    88cb775e
This tells us that we seem to be crashing because of a stack overflow, but the stack looks very funky so we don’t really know what caused the stack overflow.
Mscorwks is listed as the module that caused the crash, but this is just because mscorwks is the component that raises the native exception.
For stack overflows as most of you probably know, the most common reason is that we are in some type of recursive loop, so what we really would like to know here is what is on this stack… The reason why it is showing up with just addresses and not method names, is because debug diag doesn’t understand .net so we’ll have to bring the dump to windbg to analyze it and check out the .net stack.
In windbg we can then load up sos (.loadby sos mscorwks) and run !clrstack on the active stack to get the call stack
044ce56c 02b207e8 GameInfo..ctor(Game, System.DateTime, System.String)
044ce5a0 02b207e8 GameInfo..ctor(Game, System.DateTime, System.String)
044ce5d4 02b207e8 GameInfo..ctor(Game, System.DateTime, System.String)
044ce608 02b207e8 GameInfo..ctor(Game, System.DateTime, System.String)
044ce63c 02b207e8 GameInfo..ctor(Game, System.DateTime, System.String)
044ce670 02b207e8 GameInfo..ctor(Game, System.DateTime, System.String)
044ce6a4 02b207e8 GameInfo..ctor(Game, System.DateTime, System.String)
044ce6d8 02b207e8 GameInfo..ctor(Game, System.DateTime, System.String)
044ce70c 02b207e8 GameInfo..ctor(Game, System.DateTime, System.String)
044ce740 02b207e8 GameInfo..ctor(Game, System.DateTime, System.String)
044ce774 02b207e8 GameInfo..ctor(Game, System.DateTime, System.String)
044ce7a8 02b207e8 GameInfo..ctor(Game, System.DateTime, System.String)
044ce7dc 02b207e8 GameInfo..ctor(Game, System.DateTime, System.String)
044ce810 02b207e8 GameInfo..ctor(Game, System.DateTime, System.String)
044ce844 02b207e8 GameInfo..ctor(Game, System.DateTime, System.String)
044ce878 02b207e8 GameInfo..ctor(Game, System.DateTime, System.String)
044ce8ac 02b207e8 GameInfo..ctor(Game, System.DateTime, System.String)
044ce8e0 02b207e8 GameInfo..ctor(Game, System.DateTime, System.String)
044ce914 02b2071f GameInfo.op_Explicit(Game)
044ce938 02b20531 _Default.Button1_Click(System.Object, System.EventArgs)
044ce984 6def9ec8 System.Web.UI.WebControls.Button.OnClick(System.EventArgs)
044ce99c 6def9d2f System.Web.UI.WebControls.Button.RaisePostBackEvent(System.String)
044ce9b4 6def9f6b System.Web.UI.WebControls.Button.System.Web.UI.IPostBackEventHandler.RaisePostBackEvent(System.String)
044ce9bc 6d7f5d9e System.Web.UI.Page.RaisePostBackEvent(System.Web.UI.IPostBackEventHandler, System.String)
Once you get to this point it is pretty simple, clrstack shows a recursion, as expected, which in this case is because of a logic error in the GameInfo constructor + GameInfo explicit cast operator.
public GameInfo(Game g) : this(g, System.DateTime.Now, "admin")
{
}

public GameInfo(Game g, System.DateTime addDate, string addingUser)
{
    ID = g.ID;
    Name = g.Name;
    Publisher = g.Publisher;
    AddedDate = addDate;
    AddedBy = addingUser;
    if (g.Prequel != null)
        Prequel = ((GameInfo)g).Prequel;
}

//explicit cast
public static explicit operator GameInfo(Game g)
{
    return new GameInfo(g);
}
This was a pretty long post, but if you have a look at debug diag you’ll find that the user interface is pretty intuitive and again, i would really recommend that you have a look and consider setting up a few rules for operations to activate if the stuff hits the fan.
Laters, Tess
