
Show me the memory: Tool for visualizing virtual memory usage and GC heap usage.
A colleague of mine, John Allen, created an awesome tool way back that displays memory usage in a process very nicely. I use screenshots from it from time to time in presentations or posts but unfortunately that tool is not publicly available.
Since lots of people have asked me about it I figured I would just do a quick and dirty mock-up (based on the same ideas) and post the VS solution here.
Update 2021: I have updated the tool and added it to the DebuggingScripts github repo - however, it only works for 32Bit processes - and would need to be rewritten to support current output. 64bit address space is simply a bit too big to visualize. I still wanted to preserve the code for posterity - as it shows some interesting ways of visualizing memory.
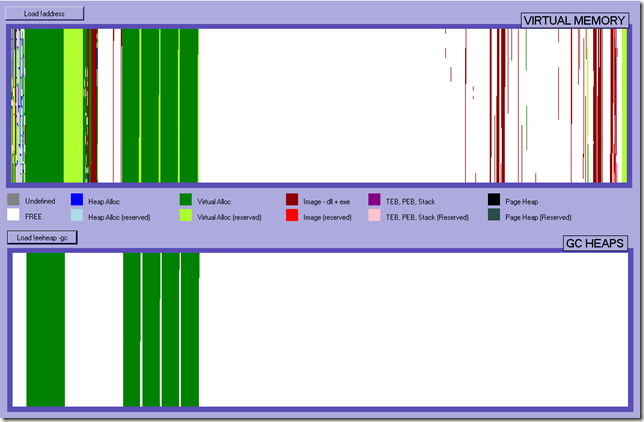
This sample tool will give you a visual overview of the virtual memory space (from a memory dump), show you where your allocations exist and what types of allocations you have. For example in the screenshot below you can see that at the beginning of the memory space we have a lot of virtual allocations (dark green – committed, light green - reserved), then we have a lot of free space (white) and towards the end of the memory space we can see our dlls scattered out (dark red).
In the bottom screen we can see our GC (.NET) Heaps. In other words, most of the virtual allocations we see in the top screen are really GC Heaps. One little caveat is that for the GC heaps it doesn’t show what is reserved for the GC heaps, only what is committed, i.e. what we actually use.
I have separated them out so that you can use the tool for non-.net apps as well if you want to.
The purpose of looking at something like this is to get a grasp for how much fragmentation we have, how much reserved vs. committed memory we have etc. and if we do have a lot of fragmentation, where should we start looking in order to reduce it.
The original tool is a bit more complex as it can read in memory dumps etc. and lets you zoom into different areas to get more details but for the most part what you see above is enough.
Disclaimer: The sample tool posted here is almost completely void of error handling, and does a lot of output parsing so just be aware that it is by no means claiming to be robust… I just wanted to get it out there so you have the functionality
To use the sample tool follow these steps in windbg
.reload
.logopen C:\addresses.txt
!address
.logclose
.logopen C:\eeheap.txt
!eeheap –gc
.logclose
Suggestions for features you might want to implement:
There is a lot of info stored in just these two files, including how much memory the process is using, how much is reserved and committed etc. as well as sizes of GC heaps, number of GC heaps and so on.
I didn’t have time to add all this but it would probably be nice to show it, as well as automatically gathering the info from a dump, or even doing the right-click on a memory area for more info + zoom in.
Feel free to build on it, and if you do and post it somewhere, please add a comment with a link to your version and share with the rest of our fellow debuggers :)
Have fun, Tess
