
Debug Diag script for troubleshooting .NET 2.0 Memory leaks
I have put together a quick and dirty debug diag script for troubleshooting .net memory leaks.
Edit 2021: I have uploaded the script to my debugging script repo for historical reasons - however, this script, in a much more refined form is now a part of the base installation of the Debug Diagnostics Tool
The reason I put it together was mainly to show how you can create your own debug diag scripts but feel free to use it to troubleshoot memory leaks, knowing that it does string parsing on the output so it is a bit prone to errors if sos changes output formats.
Note: This script will only work on .NET 2.0 x86 memory dumps
My colleague Mourad Lagas recently published a whitepaper on debug diag that talks about how to use it for various scenarios and he also explains how to create some basic scripts and I used this as my starting point.
My script loads up sos from the framework directory and goes through the following steps.
- Print .NET Framework Version
- Print information on the GC (Garbage Collector) heaps and report the amount of memory used for .NET objects
- Print and categorize the 40 most memory consuming object types (so that you can spot which object types you might be leaking or using a lot of)
- Print the finalizequeue so that you can see what objects on the heap have finalizers to verify that they are necessary. It also reports potential blocking of the finalizer including the finalizer stack so that you can see if/why your finalizer thread is blocked.
- Print objects on the large object heap
- Determine and report the size of the cache for each asp.net application in the process
- Report the number of active sessions in the process
- Check if the process was in a GC when the dump was collected as this may invalidate heap/object information
How to use the script
- Install Debug Diag 1.1
-
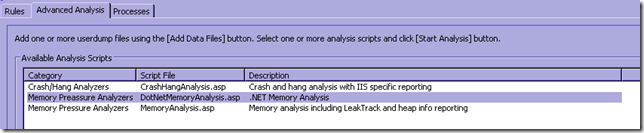
Put the DotNetMemoryAnalysis.asp file in the C:\Program Files (x86)\DebugDiag\Scripts directory (or your debugdiag/scripts directory if you installed it somewhere else)
This will add a new analysis script to the Advanced Analysis tab in debug diag:
-
Generate a memory dump when memory usage is high. With debug diag you can do this by going into the processes tab, right-click on the process and select “Create Full Userdump”
-
In the Tools/Options & Settings menu, set the “Symbol Search Path For Analysis” to
SRV*c:\websymbols*http://msdl.microsoft.com/download/symbols -
In the Advanced Analysis tab, select Add Data Files, add your memory dump, select the DotNetMemoryAnalysis.asp script and click Start Analysis.
Note: Some of the steps may take a while depending on the size of the dump).
If you get an InStr exception that means that you are either trying to debug a 64 bit dump or the sos version in your framework directory is not matching up to the framework version of the dump (i.e. the proper mscordacwks symbol could not be found)
Once the analysis is done you will be presented with a mhtm file containing the report.
Sample report
Here is a sample report generated for a dump taken for Lab 3 where the finalizer is blocked because of some bad code in the destructor for the Link object.
For this example we can see already from the analysis summary that something is fishy with the finalizer, and in the finalizer section we can also see the finalizer stack.
Scrolling down to the 40 most memory consuming object types we find a lot of Link/Link_aspx and System.Web.UI… objects, so in this case the report is pretty much straight on. In other cases it might be a bit less obvious but hopefully the suggested articles help narrow it down.
- Analysis Summary
| Type | Description | Recommendation |
|---|---|---|
| Warning | Number of objects ready for finalization: 35765 | This is an indication that your finalizer thread may be blocked. Look at finalizequeue info and finalizer stack to determine why/if the finalizer is blocked |
| Information | Cache Size: 1397928 Bytes This includes memory for objects stored in in-process sessions |
|
| Information | Number of active in-process sessions: 4000 | |
| Information | GC Heap usage: 768160596 Bytes | Common issues for high .NET Memory usage includes: Blocked finalizers, lots of memory in cache/sessions, lots of large objects and memory rooted in statics You should also review the most memory consuming objects. |
- Analysis Details
PID-5476_W3WP.EXE-DefaultAppPool-__full_1964_2009-05-07_13-58-54-165_1564.dmp
Type of Analysis Performed  .NET Memory Analysis
Machine Name                PRATHER
Operating System            Windows Server 2003 Service Pack 2
Number Of Processors        2
Process ID                  5476
Process Image               C:\WINDOWS\SysWOW64\inetsrv\w3wp.exe
System Up-Time              10 day(s) 05:48:21
Process Up-Time             8 day(s) 23:15:06
Table of contents
- How to use the script
- Sample report
- [PID-5476_W3WP.EXE-DefaultAppPool-__full_19642009-05-07_13-58-54-165_1564.dmp](#pid-5476__w3wpexe-defaultapppool-__full_1964_2009-05-07_13-58-54-165_1564dmp)
- Script Summary
.NET Version
2.0.50727.3053 retail Server mode with 2 gc heaps SOS Version: 2.0.50727.3053 retail build
.NET GC Heap Information
Number of GC Heaps: 2
------------------------------
Heap 0 (001aa5c0)
generation 0 starts at 0x39d0c6a8
generation 1 starts at 0x39005c0c
generation 2 starts at 0x02d10038
ephemeral segment allocation context: none
 segment    begin allocated     size
02d10000 02d10038  06cf1098 0x03fe1060(66981984)
16fd0000 16fd0038  1afca200 0x03ffa1c8(67084744)
1efd0000 1efd0038  22fc61f0 0x03ff61b8(67068344)
26fd0000 26fd0038  2afc1338 0x03ff1300(67048192)
2efd0000 2efd0038  32e7c290 0x03eac258(65716824)
36fd0000 36fd0038  3a0e7734 0x031176fc(51476220)
Large object heap starts at 0x0ad10038
 segment    begin allocated     size
0ad10000 0ad10038  0ad23b78 0x00013b40(80704)
Heap Size  0x16f99b74(385457012)
------------------------------
Heap 1 (001ab888)
generation 0 starts at 0x3de2921c
generation 1 starts at 0x3d17acc8
generation 2 starts at 0x06d10038
ephemeral segment allocation context: none
 segment    begin allocated     size
06d10000 06d10038  0acfe46c 0x03fee434(67036212)
1afd0000 1afd0038  1efaba04 0x03fdb9cc(66959820)
22fd0000 22fd0038  26fa3d7c 0x03fd3d44(66927940)
2afd0000 2afd0038  2efa58d8 0x03fd58a0(66934944)
32fd0000 32fd0038  36c42aa8 0x03c72a70(63384176)
3afd0000 3afd0038  3e0e39b4 0x0311397c(51460476)
Large object heap starts at 0x0cd10038
 segment    begin allocated     size
0cd10000 0cd10038  0cd10048 0x00000010(16)
Heap Size  0x16cf97e0(382703584)
------------------------------
GC Heap Size  0x2dc93354(768160596)
More information:
Compare the total GC Heap size to the number of private bytes in the process when the dump was taken (or the dump size on disk) to determine if most of your memory is on the .NET GC Heap
In the !eeheap -gc output above you can also see if most of your .NET GC memory is on the small object heaps or on the large object heap (LOH) (objects over 85000 bytes). If you see that most of your memory is on the LOH, look at the LOH output to see what those objects are.
If the GC Heap is relatively small, run debug diag with leak tracking to track native leaks and analyze the dump with the MemoryAnalysis script instead. See debug diag help for more information about this.
Related posts:
40 most memory consuming .NET object types
MT      Num items    Tot. size Type
66108d24       33         8316 System.Web.UI.RenderStyle[]
6614e4dc       35         8540 System.Web.Hosting.ISAPIWorkerRequestInProcForIIS6
79323510      363         8712 System.Collections.Stack+StackEnumerator
7932e7d0      185         8880 System.Signature
79331a6c      472         9440 System.RuntimeType
648c710c      636        10176 System.Configuration.PropertySourceInfo
66108884       33        10956 System.Web.UI.HtmlTextWriter+RenderAttribute[]
7a5eca44      576        11520 System.Collections.Specialized.HybridDictionary
79304314      194        11640 System.Reflection.ParameterInfo
7932fba8      215        12040 System.Reflection.RuntimeMethodInfo
0fbf1b90       35        13020 ASP.links_aspx
661087a0      593        14232 System.Web.UI.ControlCollection+ControlCollectionEnumerator
66107950      941        15056 System.Web.UI.Pair
648c8fa0      299        15548 System.Configuration.ConfigurationProperty
79329b58      496        15872 System.EventHandler
7933151c      232        16400 System.Char[]
7a5ecbc0      829        16580 System.Collections.Specialized.ListDictionary+DictionaryNode
648c91d4      353        16944 System.Configuration.ConfigurationValues
66113834      759        18216 System.Web.UI.Html32TextWriter+FontStackItem
79332a88      243        18484 System.Int32[]
79332b38     1627        19524 System.Int32
7a5e7dbc     1329        21264 System.Collections.Specialized.NameObjectCollectionBase+NameObjectEntry
66106ba4      315        21420 System.Web.UI.DataBoundLiteralControl
66101cd0      630        22680 System.Web.UI.ControlCollection
66101934      379        22740 System.Web.UI.LiteralControl
648c9414     1147        22940 System.Configuration.ConfigurationValue
7933335c      232        26484 System.Byte[]
661068d4      385        35420 System.Web.UI.WebControls.DataListItem
66101680      945        41580 System.Web.UI.Control+OccasionalFields
7933291c     1869        44856 System.Collections.ArrayList
79332f40      910        50960 System.Collections.Hashtable
661493a4       33        51084 System.Web.Caching.ExpiresEntry[]
6611b000     4000       192000 System.Web.SessionState.InProcSessionState
793040bc     4141       284380 System.Object[]
66148eb0     4026       289872 System.Web.Caching.CacheEntry
7933303c      948       349560 System.Collections.Hashtable+bucket[]
0fbf1edc    35999       575984 Link
79330a28    36165       723300 System.Text.StringBuilder
001a9a30     6028     43134680      Free
793308ec    47536    721577968 System.String
Total 168583 objects´

Color   Object type
Red     System.Web.UI... objects
Blue    System.Data... objects
Green   System.XML... objects
Purple  Custom objects
More Information
For more information on how to read !dumpheap -stat output, see !dumpheap -stat explained
To get info on how to dig deeper into the !dumpheap -stat output see ASP.NET Memory Investigation
Finalizer queue
SyncBlocks to be cleaned up: 0
MTA Interfaces to be released: 0
STA Interfaces to be released: 0
----------------------------------
------------------------------
Heap 0
generation 0 has 370 finalizable objects (107a9a9c->107aa064)
generation 1 has 12 finalizable objects (107a9a6c->107a9a9c)
generation 2 has 47 finalizable objects (107a99b0->107a9a6c)
Ready for finalization 17909 objects (107aa064->107bb838)
------------------------------
Heap 1
generation 0 has 247 finalizable objects (107bcb40->107bcf1c)
generation 1 has 4 finalizable objects (107bcb30->107bcb40)
generation 2 has 36 finalizable objects (107bcaa0->107bcb30)
Ready for finalization 17856 objects (107bcf1c->107ce61c)
Statistics:
      MT    Count    TotalSize Class Name
6614bbc0        1           12 System.Web.Configuration.ImpersonateTokenRef
79334808        1           20 Microsoft.Win32.SafeHandles.SafeFileMappingHandle
793347b0        1           20 Microsoft.Win32.SafeHandles.SafeViewOfFileHandle
79317fac        1           20 Microsoft.Win32.SafeHandles.SafeTokenHandle
66147c6c        1           20 System.Web.PerfInstanceDataHandle
6614b038        1           32 System.Web.Compilation.CompilationMutex
7932335c        2           40 System.Security.Cryptography.SafeProvHandle
6612f6d0        2           56 System.Web.Security.FileSecurityDescriptorWrapper
79317928        3           60 Microsoft.Win32.SafeHandles.SafeWaitHandle
79321cd0        2          120 System.Runtime.Remoting.Contexts.Context
7932a0f4        3          132 System.Threading.ReaderWriterLock
79316fb0        7          168 System.Threading.TimerBase
7932b108       14          280 Microsoft.Win32.SafeHandles.SafeRegistryHandle
661483d8       10          280 System.Web.DirMonCompletion
7932a09c       31          496 System.WeakReference
66151384       70         1680 System.Web.HttpResponseUnmanagedBufferElement
66148130       96         1920 System.Web.ApplicationImpersonationContext
66151404      100         2000 System.Web.ClientImpersonationContext
66103cb4       68         2992 System.Web.UI.WebControls.TableStyle
79330ec0       78         4368 System.Threading.Thread
0fbf1edc    35989       575824 Link
Total 36481 objects
More Information:
!finalizequeue will show all the objects on the heap that have finalizer methods, and have yet not been disposed of. It is a good idea to look through this list and verify that all your “custom” objects on this list really need finalizers/destructors, as having unnecessary finalizers will lead to higher memory consumption and a potential for blocked finalizers.
Related posts:
As the number of finalizable objects is more than 0, please check the finalizer thread to see if it is blocked or active
Finalizer Thread
OS Thread Id: 0x1534 (14)
ESP       EIP
0286f8f4 7d61ccc6 [HelperMethodFrame: 0286f8f4] System.Threading.Thread.SleepInternal(Int32)
0286f948 79299225 System.Threading.Thread.Sleep(Int32)
0286f94c 0fbe2262 Link.Finalize()
0286fc1c 79f8df9a [ContextTransitionFrame: 0286fc1c]
0286fcec 79f8df9a [GCFrame: 0286fcec]
Objects on the Large Object Heap
------------------------------
Heap 0
 Address       MT     Size
total 0 objects
------------------------------
Heap 1
 Address       MT     Size
total 0 objects
------------------------------
total 0 objects
Statistics:
      MT    Count    TotalSize Class Name
Total 0 objects
More information:
A high amount of large objects (strings and arrays over 85000 bytes) can lead to GC Heap fragmentation and thus higher memory usage in your application.
Look through the large objects, to dig deeper you can run !do on the object address in windbg, to see if these objects are expected and if you can minimize their usage in any way, by caching etc.
Common reasons for high amounts of large objects are large viewstate and Dataset serialization
Size of Web Caches in the process
sizeof(06d1cd2c) = 1397928 ( 0x1554a8) bytes (System.Web.Caching.Cache)
More information:
There is one System.Web.Caching.Cache object referencing all cached objects, per web application
In-Proc session state is stored in the cache, so the size of all session vars is also included in the size of the cache for the specific application
Related articles
Script Summary
| Script Name | Status | Error Code | Error Source | Error Description | Source Line |
|---|---|---|---|---|---|
| DotNetMemoryAnalysis.asp | Completed |
