
How does the GC work and what are the sizes of the different generations?
During our ASP.NET debugging chat there were many questions around the GC and the different generations. In this post I will try to explain the basics of how the GC works and what you should think about when developing .net applications in relation to the GC.
First off, there is already a lot written about the .net Garbage Collector. One of the best resources regarding how the GC works and how to program efficiently for the GC is Maoni’s blog. She hasn’t written anything since May 2007 but all the posts on her blog are still very relevant since the GC hasn’t really changed enough that it makes a difference as far as .net developers should be concerned.
Maoni had a presentation at the 2005 PDC about the GC and unfortunately her link to the presentation points to an invalid location so if you are interested in looking at it I have uploaded it here. Most of what I will discuss in this article is a mixture of her presentation along with things I have learned along the way, and some of the pictures in the post are taken straight from her presentation.
Table of Contents
- Table of Contents
- What are segments and heaps? How much is allocated for the GC?
- What are generations and why do we use a generational GC?
- When and how does a collection occur?
- What are roots? What keeps an object alive?
- What is the Large Object Heap? And why does it exist?
- Which GC Flavor fits my application best?
- What is the cost of a garbage collection? How can I keep this cost at a minimum?
- Additional Resources
What are segments and heaps? How much is allocated for the GC?
When you first start up a .net application the GC will allocate memory to store your .net objects.
How much it will allocate is depends on what framework version you use (including service packs or hotfixes), if you are running on x64 or x86 and what GC flavor the application is using (workstation or server)
Here is an example of how the heaps and segments look for 2.0.50727.1433 (2.0 SP1), on a dual proc running ASP.NET (the server flavor of the GC).
We have two heaps (one per logical processor since we are running the server GC) and each heap initially has one “small object” segment and one large object segment.
The initial allocation size here is 192 MB because the GC reserved 64 MB for each small object segment and 32 MB for each large object segment.
0:000> !eeheap -gc
Number of GC Heaps: 2
------------------------------
Heap 0 (001c3a88)
generation 0 starts at 0x0310d288
generation 1 starts at 0x030ee154
generation 2 starts at 0x03030038
ephemeral segment allocation context: none
segment   begin    allocated size                reserved
001c92f0  7a733370 7a754b98  0x00021828(137,256) 00004000
001c5428  790d8620 790f7d8c  0x0001f76c(128,876) 00004000
03030000 03030038 03115294 0x000e525c(938,588) 03d3f000
Large object heap starts at 0x0b030038
segment   begin     allocated  size                    reserved
0b030000 0b030038 0b4d5aa8 0x004a5a70(4,872,816) 01af8000
Heap Size 0x5cbc60(6,077,536)
------------------------------
Heap 1 (001c4a48)
generation 0 starts at 0x0712614c
generation 1 starts at 0x071014ac
generation 2 starts at 0x07030038
ephemeral segment allocation context: none
segment   begin     allocated  size                    reserved
07030000 07030038 07134158 0x00104120(1,065,248) 03d2f000
Large object heap starts at 0x0d030038
segment    begin    allocated  size                  reserved
0d030000 0d030038 0d0f3588 0x000c3550(800,080) 01f3c000
Heap Size 0x1c7670(1,865,328)
------------------------------
GC Heap Size 0x7932d0(7,942,864)
If you want to know how much the GC has reserved and committed for your particular version/flavor of the GC you can look at the performance counters # Total Committed Bytes and # Total Reserved Bytes under .net CLR memory.
You can also use !address to calculate your segment size from a dump. For example, this small object heap segment starting at 03030000.
03030000 03030038 03115294 0x000e525c(938,588) 03d3f000
has 0x002c1000 bytes committed and an additional 0x03d3f000 bytes reserved, so the small object heap segment size for this version and GC flavor is 0x002c1000+0x03d3f000 bytes = 64 MB
0:000> !address 03030000
03030000 : 03030000 - 002c1000
Type     00020000 MEM_PRIVATE
Protect  00000004 PAGE_READWRITE
State   00001000 MEM_COMMIT
Usage    RegionUsageIsVAD

0:000> !address 03030000+002c1000
03030000 : 032f1000 - 03d3f000
Type     00020000 MEM_PRIVATE
State   00002000 MEM_RESERVE
Usage    RegionUsageIsVAD
Since this is a number that is subject to change in any hotfix or service pack you shouldn’t rely on it, but if you are wondering how much you are allocating, that is the answer.
For example 2.0 SP1 (2.0.50727.1433) has a segment size of 512 MB for the small object segments and 128 MB for the large object segments so the initial allocation size is a lot bigger on 64 bit which causes generation 2 collections to occur much more seldom.
| Server GC | Workstation GC | Workstation GC+Concurrent | |
|---|---|---|---|
| # of heaps | 1 per logical processor | 1 | 1 |
Once a segment is full a new segment is created within the same heap, so a heap can have many small object heap segments and many large object heap segments but the number of .net heaps will not change during the life of the process. The memory within the segments is committed and de-committed as needed and the segments are deleted when they are no longer needed.
The two small segments at the beginning of heap 1 are used to store string constants and you can simply ignore them as they won’t really affect your application in any real sense.
What are generations and why do we use a generational GC?
In a generational GC objects are created in Gen 0 and if they are still alive when a collection happens they get promoted to Gen 1. If they are still alive when a Gen 1 collection happens they are promoted to Gen 2 etc. until they finally end up in their final resting place in the highest generation.
The idea behind a generational GC is that most objects are very temporary, like locals, parameters etc. i.e. they go out of scope while in generation 1. If we can keep collecting just these objects without having to go through all the memory we will save a lot of time and CPU power when cleaning up the objects.
The longer an object has been alive, the more likely it is that the object will be around for a very long time. Think about it, most objects that survive a couple of collections are objects that are stored in cache, session scope or in other long term storage like static variables. If we know that this is the case then we don’t have to bother constantly searching through them all.
In the .net GC there are 3 generations (0, 1, and 2) and then there are the large objects (objects over 85000) that end up in a separate segment. The LOH objects are different in the sense that even if they survive a collection they are not promoted since they exist outside of Gen 0, 1, and 2.
There are a few other benefits to a generational garbage collector because of how allocations are done.
If we look at our first heap:
Heap 0 (001c3a88)
generation 0 starts at 0x0310d288
generation 1 starts at 0x030ee154
generation 2 starts at 0x03030038
ephemeral segment allocation context: none
segment begin allocated size reserved
…
03030000 03030038 03115294 0x000e525c(938,588) 03d3f000
The small object segment would look like this, where the green part is Gen 2, blue is Gen 1 and Orange is Gen 0

When a new object is allocated it will be allocated right after the last object on the heap (in gen 0) at address 0x03115294 and it will continue like that, growing until Gen 0 has reached its budget at which point a garbage collection will occur.
Since objects are allocated sequentially in the segment the cost of allocation is extremely small. It consists of taking a cheap lock (on single proc), moving a pointer forward, clearing the memory for a new object and register the new object with the finalize queue if it has a finalizer/destructor. The fact that they are allocated sequentially also gives a few other benefits such as locality of time and reference which means that objects that are allocated in the same method at the same time are stored close together. Since they are allocated at the same time/place they are likely to be used together and accessing them will be very quick.
Generation 1 and 0 live in something called the ephemeral segment (the first small object segment in each heap) and the size of Gen 1 and Gen 0 can never exceed the size of a segment. If a new segment is created that will become the new ephemeral segment. Gen 2 on the other hand can grow indefinitely (or until you run out of memory) so if you have high memory consumption a large amount of your objects will live in Gen 2.
The budgets for generation 1 and 0 vary over time based on the allocation pattern of the process and how much is actually collected during each collection. You can see what the current budget for Gen 0 is by looking at the .net CLR memory/Gen 0 heap size.
When and how does a collection occur?
A collection occurs
- When you allocate a new object and the generation 0 budget is reached, i.e. if the new object would cause it to go over budget.
- When someone calls GC.Collect (Induced GC)
- Based on memory pressure
Contrary to popular belief collections don’t happen at certain time intervals etc. so this means that if your application is not allocating any memory and is not calling GC.Collect, no collections will occur. It is also important to understand that collections of the higher generations will only occur once their budgets are reached, and in the case of 64-bit processes gen 2 collections occur very seldom which means that a lot of memory may be sitting around even though it is not in use, just because it made its way into gen 2.
If you have a process (64 or 32 bit) that does not use a lot of .net objects, but does use a lot of native resources like threads, connections etc. you may end up in a situation, if you are not properly cleaning up the threads, connections etc. where you run out of native resources and handles because the objects have not been collected. Therefore it is absolutely crucial that you do dispose/close all objects that have native resources right after you are finished using them.
A garbage collection simplified goes through the following sequence
- Suspend all threads that are making .net calls (i.e. could be allocating objects or modifying the objects on the heap). Threads making native calls are suspended on their return to managed code.
- Determine which objects in the current generation can be garbage collected. This is done by asking the JIT, the EE Stack Walker, the Handle table and the finalize queue which objects are still accessible/in use. See maonis post “I am a happy janitor” for more info on this.
- Delete all marked objects or add the empty spaces to a free list if the heap is not compacted.
- Compact/Move the leftover objects to the backend of the heap (this is the most expensive part)
- Resume all threads
Here is a collection, step by step (with pictures from Maonis presentation)
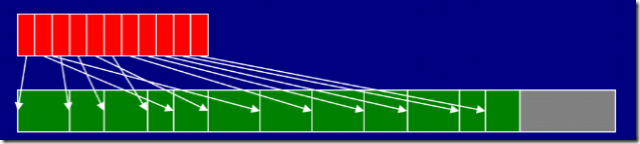
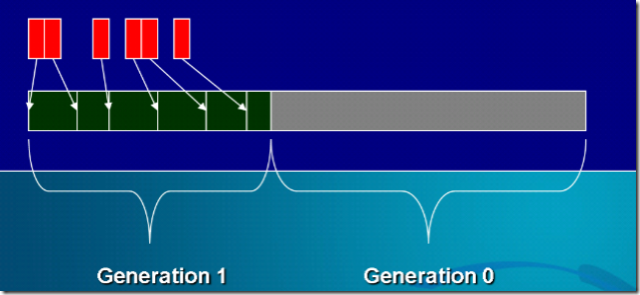
Allocate new objects at the end of the heap in Gen 0
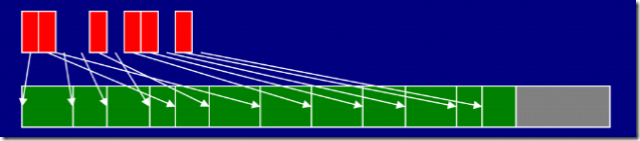
Determine which objects are still accessible
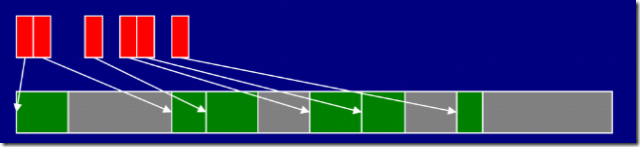
Sweep the garbage and add the free blocks to the free-list to store new objects there if non-compacting
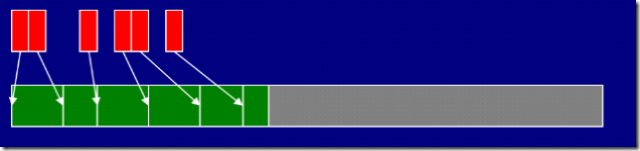
Compact the heap
Move the start of generation 0 to the end of the objects that survived. The survivors are now in generation 1
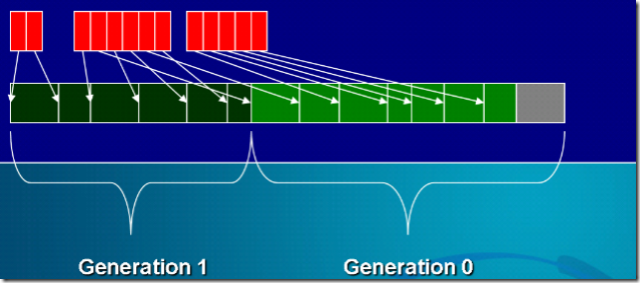
New objects are allocated in generation 0
A gen 1 collection can’t occur without a Gen 0 collection so any time a Gen 1 collection occurs it will be a Gen 1 + Gen 0, and same of course for Gen 2.
What are roots? What keeps an object alive?
If your object is rooted, that means that an object (a root) has a reference (directly or indirectly) to your object, and that that root object is either on a stack as a parameter or local, or it is a static variable, or it is on the finalizer queue, meaning that it needs to be finalized before it can be released. See this post for a discussion of different types of roots and what they mean.
An object is also considered alive if it is referenced by an object in an older generation, until that older object is collected of course.
What is the Large Object Heap? And why does it exist?
The large object heap is a special segment (or multiple segments) in a heap, specifically meant for objects over 85000 bytes. As I have mentioned many times before in my posts this 85000 refers to the size of the object itself, not the size of the object and all its children.
The example I always use is a large dataset. The dataset itself is merely a collection of a few links to different arrays, so the dataset object will never grow independently of the number of rows or columns it has, it will consistently stay at 80 bytes or 120 bytes etc. (different in different framework versions). In other words the dataset will never make it to the large object heap.
The objects that will be stored on the large object heap are usually strings and arrays of different kinds since a string is stored in one contiguous chunk rather than a linked list of the different characters. Same thing with an array, but again, here it is important to understand that it is just the size/length of the array that determines if it is a large object or not, not the total size of the objects that it references.
When you create a large object, for example a large string, it immediately goes on the large object heap segment so it is never even allocated in gen 0. As mentioned before the large object heap segment is not generational, if an object in the LOH is alive during a collection, it simply stays on the LOH.
The reasoning behind having a special heap for large objects is that it is very expensive to move them around, and particularly for arrays for example, it is very expensive to update all the references etc. Therefore the LOH is not compacted, instead any space that is left between objects when a garbage collections occur are put on a free-list so that if a new object is allocated it can be allocated in that free space. If multiple collections occur causing two or more free spaces after each other these are coalesced into one larger free space.
The large object heap is collected when a gen 2 collection occurs.
Which GC Flavor fits my application best?
At present there are three different versions / flavors of the GC, each optimized for different types of applications.
Server GC
The server GC is optimized for high throughput and high scalability in server applications where there is a consistent load and requests are allocating and de-allocating memory at a high rate. The server GC uses one heap and one GC thread per processor and tries to balance the heaps as much as possible. At the time of a garbage collection, the GC threads work on their respective threads and rendez-vous at certain points. Since they all work on their own heaps, minimal locking etc. is needed which makes it very efficient in this type of situation.
The Server GC is only available on multi processor machines. If you try to set the server GC on a uni proc machine you will instead get the workstation version with non concurrent GC.
This flavor is what ASP.NET uses by default on multi processor machines, as well as a number of other server applications. If you want to use the server GC in a windows service you can do so by setting
<configuration>
 <runtime>
   <gcServer enabled="true" />
 </runtime>
</configuration>
In the applications config file
Workstation GC – Concurrent
This is the default setting for win forms applications and windows services.
The Workstation GC is optimized for interactive applications that can’t allow for the application to be paused even for relatively short periods since pausing the threads would cause flicker in the user interface or make the application feel non responsive to button clicks etc.
This is done by trading CPU and memory usage for shorter pause time when doing generation 2 collections.
Workstation GC – Non Concurrent
The non-concurrent Workstation GC mimics the server GC except for that collections are done on the thread that triggers the GC. This mode is recommended for server type applications running on a single proc box.
You can turn concurrency off in the application config file
<configuration>
 <runtime>
   <gcConcurrent enabled="false" />
 </runtime>
</configuration>
| Concurrent WS | Non-Concurrent WS | Server GC | |
|---|---|---|---|
| Design Goal | Balance throughput and responsiveness for client apps with UI | Maximize throughput on single-proc machines | Maximize throughput on MP machines for server apps that create multiple threads to handle the same types of requests |
| Number of heaps | 1 | 1 | 1 per processor (HT aware) |
| GC threads | The thread which performs the allocation that triggers the GC | The thread which performs the allocation that triggers the GC | 1 dedicated GC thread per processor |
| EE Suspension | EE is suspended much shorter but several times during a GC | EE is suspended during a GC | EE is suspended during a GC |
| Config setting | <gcConcurrent enabled="true"> |
<gcConcurrent enabled="false"> |
<gcServer enabled="true"> |
| On a single processor machine | WS GC + non-concurrent |
What is the cost of a garbage collection? How can I keep this cost at a minimum?
You can measure the GC cost for your application with a few different counters. Remember that all of these counters are updated at the end of a collection which means that if you use averages they may not be valid after a long time of inactivity.
- .NET CLR Memory\% time in GC - This counter measures the amount of CPU time you spend in GC and it is calculated as (CPU time for GC/CPU time since last GC)
- .NET CLR Memory# Induced GC – This is the number of garbage collections that have occurred as a result of someone calling GC.Collect(). Ideally this should be 0 since inducing full collections means that you spend more time in the GC, and also because the GC continuously adapts itself to the allocation patterns in the application, and performing manual GCs skews this optimization.
- .NET CLR Memory# Gen X collections – This counter displays the amount of collections that have been performed for a given generation. Since the cost of gen 2 collections is high compared to Gen 1 and Gen 0 you want to have as few Gen 2 collections per Gen 1 and Gen 0 collections as possible. A ratio of 1:10:100 is pretty good.
The most common causes for high CPU in GC or a high number of Gen 2 collections compared to 1 and 0 is high allocation of large objects and letting objects survive multiple generations because of improper use of finalizers or because finalizable objects are not disposed of correctly in the application.
Additional Resources
- Maonis blog
- Generational GC - A post-it analogy
- .NET Hang Case Study: The GC-Loader Lock Deadlock (a story of mixed mode dlls)
- ASP.NET Case Study: High CPU in GC - Large objects and high allocation rates
- ASP.NET Case Study: Bad perf, high memory usage and high CPU in GC - Death By ViewState
- .Net memory leak: Unblock my finalizer
- .NET Memory: My object is not rooted, why wasn’t it garbage collected?
- Who is this OutOfMemory guy and why does he make my process crash when I have plenty of memory left?
- .NET Garbage Collector PopQuiz - Followup
- Maonis presentation at PDC 2005
