
Pimp up your debugger: Creating a custom workspace for windbg debugging
From time to time I get questions about how to change settings in windbg like this one…
The default color scheme for the command window is really annoying, because it is always black and white. It is really hard to figure out something in the screen after you have executed some commands that generates lots of output, especially for the command you entered.
Then I tried to configure the colors through view -> options -> colors, unfortunately I failed because of the items listed there which was not documented well. After google for some time, I still did not get something interesting.
I am absolutely horrible with colors and the combination of colors. I usually wear all black clothes with bright fuchsia sneakers :) so before I answer the question above, let me just say that I am not going to advice on color combinations for windbg, I’ll just show you how I have set up my windbg environment so that you can set up your own the way you like it.
Windbg Workspaces
Windbg uses workspaces to store the information about your debugging session setup, i.e. what colors you use, what windows will be opened and where, what your symbol and source path is etc. The Workspace Contents portion of the windbg help file tells you more about what it stores.
There are a couple of different types of workspaces that get loaded
- The base workspace is used when WinDbg is in a dormant state.
- The default user-mode workspace is used when you are attaching to a user-mode process (by using the -p command-line option or by using the File/Attach to a Process command).
- The remote default workspace is used when you are connecting to a debugging server.
- The default kernel-mode workspace is used when WinDbg begins a kernel-mode debugging session.
- The processor-specific workspace is used during kernel-mode debugging after WinDbg attaches to the target computer. There are separate processor-specific workspaces for x86-based, Itanium-based, and x64-based processors.
- Named (user defined) workspaces that get loaded on demand (through File/Open Workspace)
When you start up windbg it starts up with the base workspace, and then when you load up a memory dump you will either stay in that workspace or if you have choose to “save workspace” the previous time you looked at this dump it will load up that workspace. When you do “save workspace” when looking at a dump it will create a specific workspace for that dump.
Themes
Windbg also has a set of predefined Themes that are stored in the debugging tools for windows\themes folder, and you can use these to jump-start your own custom workspace.
My Debugging Environment step-by-step
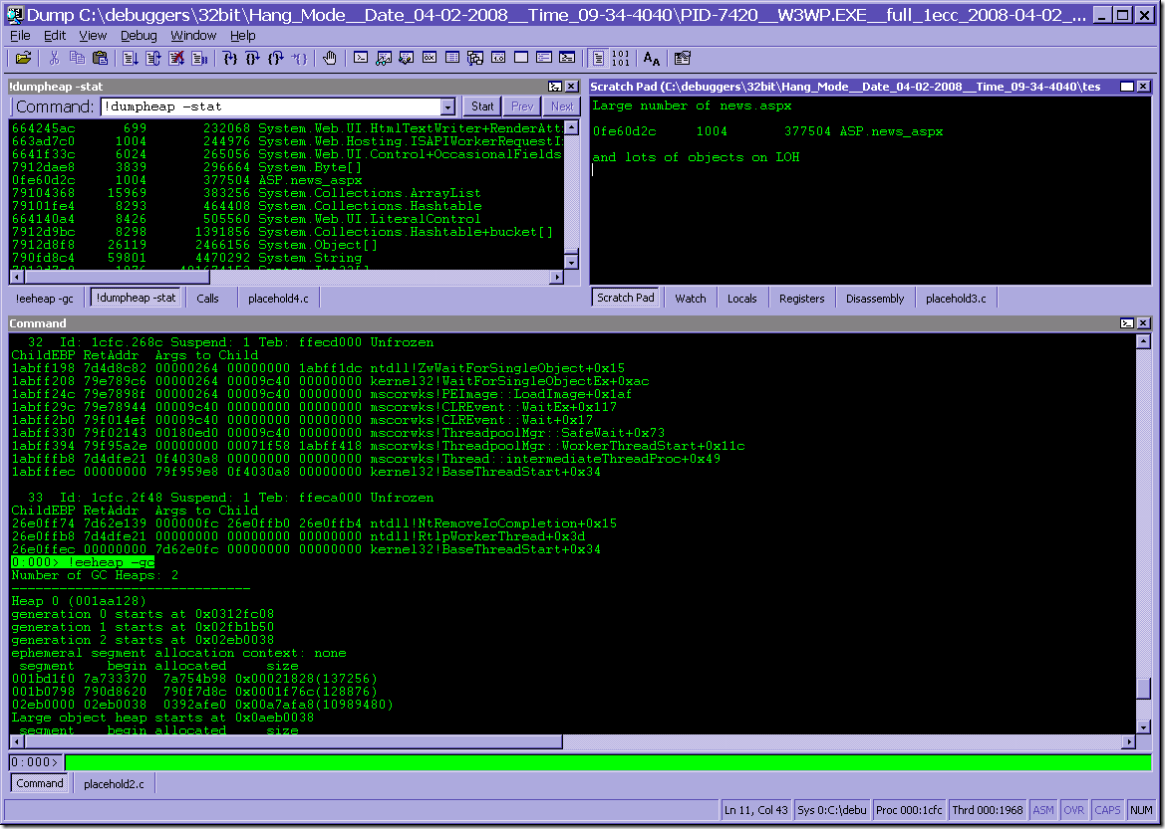
This is my debugging environment for memory dumps. Apart from changing the colors I have also added a few windows that are useful when debugging such as
- Two command browser windows (currently used for
!eeheap -gcand!dumpheap -stat). Command browser windows allow you to execute a command and leave the results in the window so you don’t have to scroll up and down to see the results. For example here I use it for!dumpheap -statand I can copy and paste MTs from the output to use in commands in the regular command window. While debugging I can change the command here if I want to type.browse ~* e !clrstackfor example in the command window. - The Calls window shows the call stack of the current thread which is nice if you want to jump between frames in the stack to view locals etc.
- The Scratch Pad is probably my favorite feature. It’s like notepad in the debugger so if you find some interesting stuff you can just add notes here, and if you right click on it you can associate it with a file so that your notes get stored to disk.
- Watch, Locals and Registers are pretty self explanatory
- The Disassembly window shows the disassembly of the method you are executing on the current thread
- The command window is where all the fun stuff happens, i.e. where your commands are executed
To get this look I started off by reading the Themes.doc in the debugging tools for windows\themes directory and followed the instructions to start a new workspace. I chose the Standard.reg registry file to start setting things up.
Next I opened windbg without opening a dump file and removed some of the windows that I didn’t like, including a placeholder and added the windows above from the View menu (note: the !eeheap -gc and !dumpheap -stat windows are Command Browser windows), and finally i positioned them as shown above.
The colors are a bit tricky to understand so I’ll try to give an explanation of what they all mean along with what colors I used for each setting. The colors are changed under view/options (the ones in bold are the ones that i have changed)
| Color name | My bg - text choice | Description |
|---|---|---|
| Background | black | Background for all windows (including source and disassembly windows) |
| Text | lime | All text that is not described elsewhere |
| Current line | black on lime | for the current line in the source and disassembly windows |
| Breakpoint current line | white on fuchsia | if the current line is an active breakpoint |
| Enabled breakpoint | white on red | active breakpoint that is not on the current line |
| Disabled breakpoint | white on yellow | disabled breakpoint |
| Changed data text | red (on black) | data that has changed in the registers, locals and watch windows |
| Source … | various | colors for numeric constants, character constants etc. in the source window. I have changed all black to lime and all others to lighter colors so that they stand out on the black background. |
| Disabled window | dark grey | shown when a window is disabled, for example. the registers windows while you are not stopped at a breakpoint. |
| Normal level command window | lime on black | command output |
| Error level command window | red on black | error messages in command output |
| Warning level command window | orange on black | warnings (ex. symbol warnings) in command output |
| Verbose level command window | blue on black | additional info only displayed when you have view/verbose output turned on. For example module load info etc. |
| Prompt level command window | black on lime | command prompt and commands displayed in the command window. eg. !eeheap -gc above. It is nice to have this in a different color than the command output so that you can see where the command output starts. |
| Prompt registers level command window | lime on black | register output |
For the rest of the colors I chose lime on black wherever it was black on whit except for for warnings or errors in which case I chose orange on black and red on black.
Apart from this I have also associated dump files with windbg as described in this article to setup the symbol path and load extensions automatically, but since then I have changed it to load up the 2.0 version of sos instead.
If you want to you can even set up different command files for different scenarios, for example for memory issues you may want to add .browse !dumpheap -stat or similar to have this information ready as soon as you open the dump, or .browse .time;.echo "***";!runaway for high CPU hangs.
Finally, when all this was set up I closed windbg and answered yes to save information for workspace? for the workspace base and now whenever I open a dump I already have all the windows that I have, the way I want them.
Have fun, Tess
