
Using VSTS Test and Profilers to troubleshoot performance issues (low cpu hang)
I’ve been wanting to dig into the Test features in Visual Studio Team System for a while to “debug” issues during the test phase. In my previous post I linked to a Swedish screen cast by Mikael Deurell, but for those of you who don’t know Swedish I thought I’d walk through troubleshooting a couple of my labs using the Visual Studio Team System Profiler and Load Tests.
Problem description
The issue we will troubleshoot comes from lab 1 in my BuggyBits lab set, and the scenario here is that we see that the execution times for the page FeaturedProducts.aspx keep increasing, and under load the page even times out.
Those of you who have walked through the labs will of course know what the underlying issue and resolution is, so please act surprised when you get to the end:)
So what we want to accomplish here is
- Set up a load test against http://localhost/buggybits/featuredproducts.aspx
- Profile the application to figure out where we are spending all our time
Note: The steps shown here for profiling should work equally well for profiling any type of application, including win forms applications.
Creating and configuring the test projects
- Open the BuggyBits website (In visual studio)
- Add a new Test project called BuggyBits Test
- Remove the files AuthoringTests.txt, ManualTest1.mht and UnitTest1.cs since we wont be using them
-
Add a new Web Test called Featured.webtest
This will start a recording session for your web test opening up a new browser. If you get a message “Currently browser extensions are disabled in Internet Explorer” you can press Alt when the Internet Explorer comes up to get the menus and choose view/Exploerer bar/Web Test Recorder 9.0 from the menu to start recording.
Record the test by browsing to http://localhost/BuggyBits/FeaturedProducts.aspx and select stop recording when the page comes back. This will add a request to http://localhost/buggybits/FeaturedProducts.aspx to the web test. Now, if you wanted to record more requests in the same session you could just continue browsing before you click stop.
-
Add a new Load Test to stress the http://localhost/BuggyBits/FeaturedProducts.aspx page
This will bring up the New Load Test Wizard, you can just skip through til you get to the Test Mix dialog where you add the Featured.webtest test and then skip through again until you reach the Run Settings where you can set the Run duration to 2 or 5 minutes instead of the normal 10 minutes.
Rename the test from LoadTest1.loadtest to FeatureLoad.loadtest when you’re done
Note: There are many things you can do in here including setting up counter sets etc. for your load test, but I will be skipping these for now since we are just going to use the load test to create load for our profiling session.
Running the load test
The load test is now ready to run and you can run it using the run button to see how it fares.

This will bring up a number of graphs showing you the basic counters. As mentioned before you could also add other counters that you are interested in and set triggers on them but for the purposes of this exercise we will just take a brief look at the standard counter set and move on to the performance session.
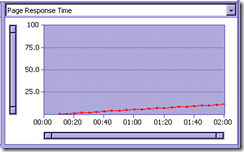
The most interesting graphs for this issue are the Page Response Time which shows the Avg. Page Time, i.e. how long each page of the test took to execute, and we can see it increasing throughout the load test which is consistent with the problem description.
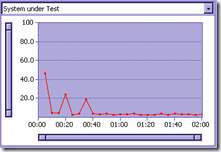
In the System under Test graph I am plotting % Processor Time on the machine, and as you can see we are dealing with a low cpu performance issue which means that we are spending most of our time waiting.
Adding a performance session
With the FeatureLoad.loadtest window open, click on the “Create a performance session for this test” button.

This will add a performance session to the load test. A performance session allows you to get information about which methods took a long time to execute, which methods allocated the most memory etc.
When you add a performance session to a test, what you are really doing is creating a performance session, and when you start that performance session the first thing it will do (after attaching to the process (and instrumenting the bits if chosen)) is to start your test. That way you don’t have to both start a perf session and a test, but it would be the same as creating a separate performance session, starting this and then starting your load test.
The performance wizard that comes up has 4 steps
- Step 1 – Information – Click next
- Step 2 – Specify profiling method, short and sweet, for high CPU sampling is usually better, for low CPU instrumentation is usually better, since ours is a low cpu we will choose instrumentation and click next
- Step 3 – Specify the application to be profiled – This should be pre populated for us with the http://localhost/BuggyBits application so we can click next
- Step 4 – Confirm and finish
Running the performance session
If you open up the Performance Explorer window you should now see a Performance session called FeatureLoad containing your load test and with the profiling method set to Instrumentation
Start the session by clicking the Launch with Profiler button
In the output window you should see messages like
Profiler started
OnTestRunStarted(7b3e3588-fea6-4172-94a9-683b3a43d3ce)
Instrumentation Succeeded:C:\WINDOWS\Microsoft.NET\Framework\v2.0.50727\Temporary ASP.NET Files\buggybits\b27906cc\f5f91899\App_Code.sveh1hhn.dll
Instrumentation Succeeded:C:\WINDOWS\Microsoft.NET\Framework\v2.0.50727\Temporary ASP.NET Files\buggybits\b27906cc\f5f91899\App_global.asax.-r1dattg.dll
Successfully attached to process: 6476
Instrumentation Succeeded:C:\WINDOWS\Microsoft.NET\Framework\v2.0.50727\Temporary ASP.NET Files\buggybits\b27906cc\f5f91899\App_Web_prgsmyy7.dll
Instrumentation Succeeded:C:\WINDOWS\Microsoft.NET\Framework\v2.0.50727\Temporary ASP.NET Files\buggybits\b27906cc\f5f91899\App_Web_nomnlqw7.dll
You can switch over to the Test Results window to see the test results and if you double click on the FeaturedLoad test in the test results window this will bring up the graphs you saw when running the load test before.
Once the load test is finished, stop your performance session by pressing the stop button in Performance Explorer
Analyzing the results
Now we have collected all the data and we are ready to dig into what caused the performance issue.
In the performance explorer, a new vsp file containing the performance report should now be available in the Reports folder of the FeaturedLoad performance session.
It will automatically start with the Summary view which shows the following for a 2 minute run
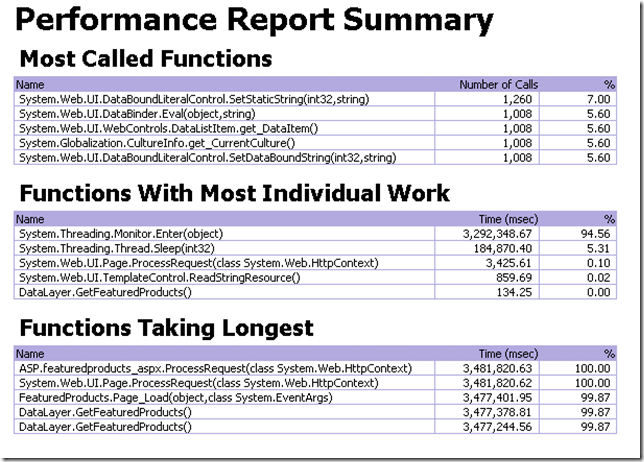
By far, the method we have spent the most time in here is the System.Threading.Monitor.Enter method (which basically means that we have been stuck in a lock), and as you can see we have spent 94.56% of our time here.
If we double-click on this it brings us to the functions view, and if we double-click it again we get to the Caller/Callee view which shows us who calls this method.
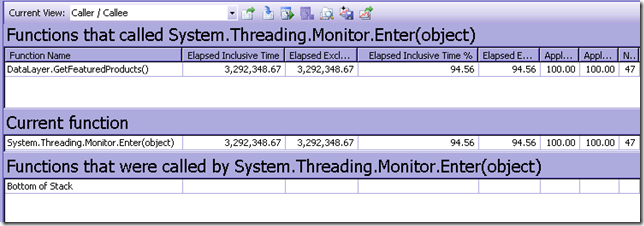
In this case we can see that the only method in this test that calls Monitor.Enter is DataLayer.GetFeaturedProducts, so this is where we are stuck in the lock… If we would have had multiple callers here, we would have been interested in the one/s with most Elapsed Inclusive Time
We can double-click on the GetFeaturedProducts method here to see information about it’s callees, and we can see that Elapsed exclusive time for GetFeaturedProducts is almost 0% so we spend most of our time in the methods we call. And the time we spend in the callees is topped by the Monitor.Enter method of course where we spend 94,56% of the time, followed by Thread.Sleep where we spend 5,31% of our time…
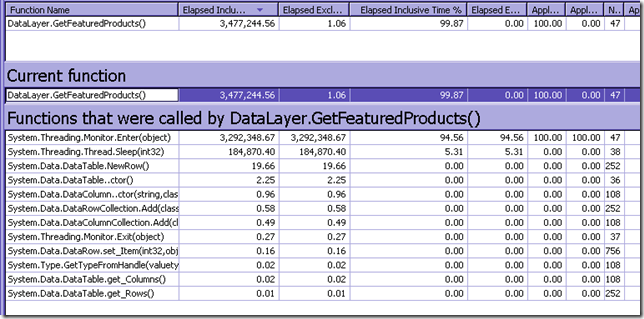
So now we have a very good idea of where we spend our time, i.e. to resolve the issue we need to be looking at why we are stuck in a lock in this method.
Double-clicking on the GetFeaturedProducts method under Current Function takes us to the actual code
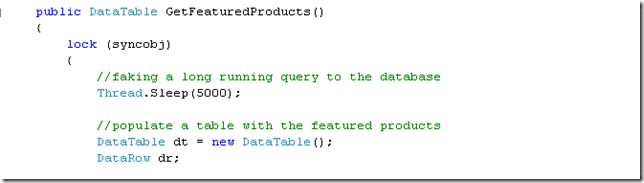
And from here it is a pretty easy task to see what we need to optimize (i.e. the Sleep that is supposed to represent a long database call).
Note: If it would have in fact been a long database query, we would have very likely seen a System.Data.SqlClient.SqlCommand.ExecuteReader or similar as the 2nd topmost method in the callees list for GetFeaturedProducts.
I hope this has given you a brief insight into troubleshooting these kind of issues if you discover them in the test phase, and I will probably follow up with some similar posts for high CPU issues and memory issues as well.
Until then, Tess
