
Using VSTS Test and Profilers to troubleshoot a High CPU in GC issue
Following my post about how to troubleshoot a low CPU performance issue with VSTS Test, I will now do the same for lab 4 where we have high CPU in GC.
The scenario is pretty similar in that we have a page (http://localhost/BuggyBits/AllProducts.aspx) that seems to be taking a lot of time to execute. We also see that the w3wp.exe process sits at very high CPU ~100% during the time this page executes.
Using Windbg in the lab, we saw that the issue here was that we were concatenating a very large string in a loop. This was generating a lot of full collections since we were constantly exhausting the large object heap, causing us to spend a lot of time in the GC. Check out the review for Lab 4 for more details on the issue.
What are we going to accomplish here?
These are the steps I will go through to narrow down the issue to the string concatenation:
- Set up a load test for AllProducts.aspx and configure the counter set to include .net and process counters for w3wp.exe
- Run a sampling performance session to discover that we are spending most of our time in the GC. Here I will also set up a symbol server to be able to see profiling for some native (non .net) methods.
- Look at the threshold violations and some interesting .net counters for the load test
- Run an instrumentation performance session to see in which .net methods we are spending most of our time.
Since I went through how to set up a test project, web test, load test and a performance session in the previous post I will only brush on it here to save some electrons
Setting up and configuring a load test for AllProducts.aspx
- Create a new web test with a request to http://localhost/buggybits/allproducts.aspx
- Create a new load test using the allproducts web test, set it to run for 2 minutes leaving all the rest as defaults.
-
Add w3wp.exe as an instance for .NET CLR Memory counters and Process counters
- Under Counter Sets, expand the .Net Application counter set.
- Right-click on Counter tags and choose Add Counters.
- For the .NET CLR Memory performance category, choose all counters, and w3wp.exe as the instance.
- Remove _Global from the instance list for .NET CLR Memory by expanding the .NET CLR Memory node in the tree view and removing it under Counter Instances.
Do the same thing for the process counter under Controller.
-
Add the .NET Application counters to the test
- Under Run Settings, right-click on Counter Set Mappings and choose Manage Counter Sets
- Click Add Computer, type in localhost and check the checkbox for .NET Application
Running a sampling performance session
- On the AllProducts.loadtest, click on the Create Performance Session for this Test button to start the performance wizard.
- Choose Sampling as the profiling method since this is a high CPU situation and click through the rest of the wizard.
-
In the Performance Explorer, start the test by clicking on the Launch with Profiling button.
When the test has finished running, you should see a Performance Report Summary. Note that this might take a while to produce since the w3wp.exe process will be running at around 100% long after the load test is finished.
The Performance report summary will show that most of the CPU cycles are spent in [mscorwks.dll]. This is because we haven’t yet set up symbols so that the performance report can report the actual methods that are running.
-
Close the report and set up symbols to get some good data.
- Under tools/options, expand the debugging node and select symbols.
- Click on the new folder button and type in symsrvsymsrv.dllc:\webcache*http://msdl.microsoft.com/download/symbols for the path. This will cause Visual Studio to go out to Microsofts public symbol server to look up symbol files (pdb files). The path between the ** tells it where to cache local copies of the symbols so it doesn’t have to go out on the internet everytime.
-
Open the report again. This time you should see messages like
Symbol Engine: Loading symbols for module 'C:\WINDOWS\Microsoft.NET\Framework\v2.0.50727\Temporary ASP.NET Files\buggybits\b27906cc\f5f91899\App_Web_b9uwda_7.dll'in the output window, and the performance report summary should now look something like
Note: It might take a really long time to produce this the first time since it has to download the symbols
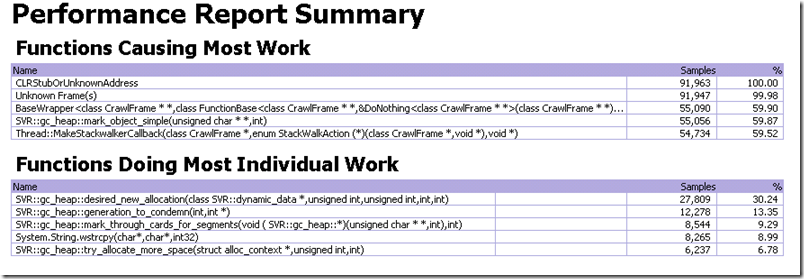
From the Performance Report Summary we produced we can see that most of our time is spent in GC related functions. With this we can make some assumptions but since the GC runs on dedicated threads in the server version of the GC we can’t really see what caused us to GC so much.
Looking at threshold violations and performance counters
If we bring up the load test results for this session, we will find that it has a large number of threshold violation

A threshold violation means that during the test, a threshold rule for a performance counter has been violated. You can set up rules on your own for counters, saying that for example it should generate a warning when CPU usage goes over 70% or when Available MB is below 100 MB or similar.
A few of the performance counters have default rules, and if we click on the link to bring up our threshold violations we see that we frequently violate the threshold of 25% set up for the .NET CLR Memory/% Time in GC.
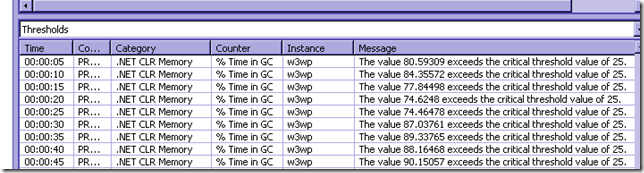
This confirms the suspicions from our sampling session about high CPU in GC being our issue. So now we need to look at what is causing this high CPU in GC.
As mentioned earlier, high CPU in GC usually means that we are doing a lot of full collections (Gen 2) compared to Gen 1 and Gen 0 collections. Again, look at the lab 4 walkthrough for more details on this…
To see the the values and trend for .NET CLR Memory\% Time in GC, # Gen 0 Collections, # Gen 1 Collections and # Gen 2 Collections you can bring up the graphs in the LoadTest results and right-click and choose Show Counters on Graph on these counters under Computers/MachineName/.NET CLR Memory. They will show on the Key Indicators graph.
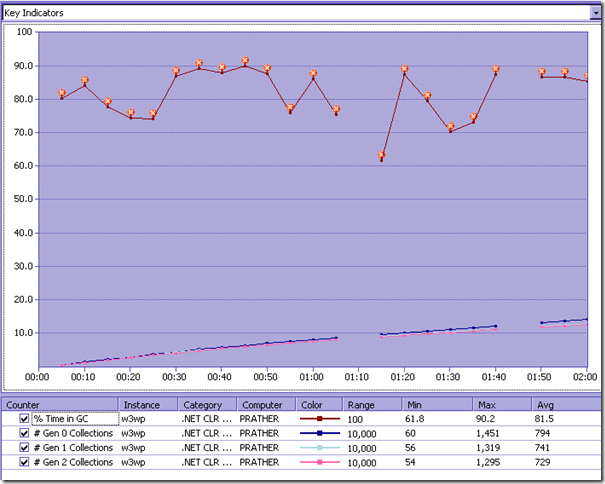
Here we can see that the number of Gen 0, Gen 1, and Gen 2 collections are very similar, i.e. there is almost a 1:1:1 ratio between them. Normally, and preferably, we should see a lot of Gen 0 for each Gen 1, and a lot of Gen 1 for each Gen 2. This 1:1:1 ratio means that pretty much every collection that we make is a full one (Gen 2), since full collections are very expensive comparatively there is no wonder we are spending a lot of our time in the GC. The average % Time in GC is 81.5% which is extremely high… in a healthy application we should spend somewhere around 5-30% in GC.
Note: The counter lines are broken in some places, this is because we were running at a 100% CPU so we didn’t get a chance to read the counters…
Again as I mentioned before, the reason for this type of ratio 1:1:1 is usually that we are overloading the large object heap, and when an LOH segment is exhausted we perform a full collection… so the next question is what is causing this…
In order to figure this out I will run an instrumentation performance session since that will tell us where we are stuck waiting for the GC most of the time…
Running an instrumentation performance session
To run an instrumentation performance session for this test we can simply reuse the same performance session and change the method from sampling to instrumentation in the Performance Explorer

and then rerun the performance session…
Instrumentation means that we add tags in the methods so that we record the times when we enter and leave a method, and thus we can see how long time we are spending in them.
Once the performance session is done, we get the Performance Report Summary (note that again this will not appear until the CPU time starts going down in the process)
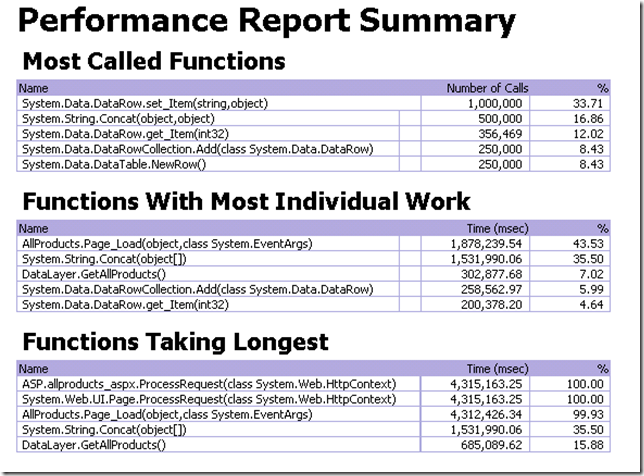
The top two methods where we spend most of our time (inclusive, i.e. including the methods it calls) is AllProducts.Page_Load() and System.String.Concat().
Drilling into the Page_Load method (by double clicking it once here and double clicking it again in the functions pane) we get the following:
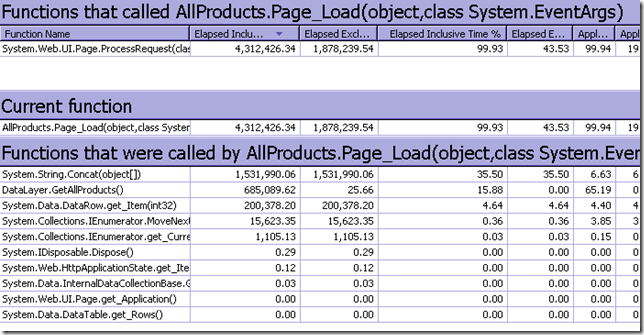
So here we can see that most of the time spent in the Page_Load method, is actually spent inside the System.String.Concat method. Extrapolating from the results before we can say that most of the time when we are waiting for a GC, this is triggered by an allocation made in String.Concat, comming from the Page_Load method.
We can double click on the Page_Load method here to get to the code
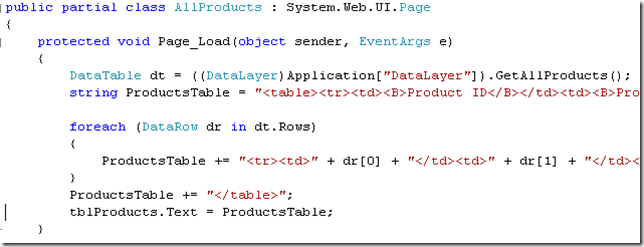
And here we can see the cause of our issue, i.e. that we are concatenating very large strings (assuming that the dataset is pretty big, which it is in this case), in a loop.
Final thoughts
I know that you need some previous knowledge about how the GC works, what the common causes are for high CPU in GC etc. to jump to some of the conclusions that I jumped to… but still, even without this knowledge, with this method you can drill down to the exact cause of the issue. i.e. the string concatenation
Hopefully, with these tips you will be able to catch some of your performance issues in the test phase before they get into your production environment :)
Laters, Tess
