
Capturing memory dumps for 32-bit processes on an x64 machine
This is an issue that I often get questions around and we often have cases where we have to re-capture memory dumps because the memory dumps were captured the “wrong” way.
The short story is: If you are executing a 32-bit process on a 64-bit machine, (which is the default case for IIS on x64 machines for example) you need to capture the dump with a tool that allows you to create 32-bit dumps.
How do you know if your process is 32-bit
If you are on a 64-bit machine, you can check task manager to see what architecture your process is using.
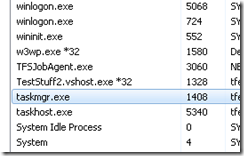
Processes with *32 are 32-bit and the rest are 64-bit so in the example above we can see that for example w3wp.exe is executing 32-bit code.
Why is it important to capture them with the right tools
If you capture a dump with a tool that captures 64-bit dumps you will still get a memory dump, but you will get a memory dump of the syswow64 which means that a lot of extensions like sos and psscor2 won’t be able to read the data. Some things may still work but it is very limited and you might get errors or erroneous call stacks etc.
Typical stuff that happens when you try to read a 64-bit memory dump of a 32-bit process is:
-
You may see warnings like
WARNING: wkscli overlaps srvcli ..............WARNING: wship6 overlaps dnsapi .WARNING: IPHLPAPI overlaps dsrole ...WARNING: FWPUCLNT overlaps rasadhlp WARNING: FWPUCLNT overlaps dnsapi .....WARNING: compstat overlaps iisres -
The stacks show wow64cpu methods
0:000> kp Child-SP RetAddr Call Site 00000000`000ce728 00000000`73a22bcd wow64cpu!CpupSyscallStub+0x9 00000000`000ce730 00000000`73a9d07e wow64cpu!Thunk0ArgReloadState+0x1a 00000000`000ce7f0 00000000`73a9c549 wow64!RunCpuSimulation+0xa 00000000`000ce840 00000000`76d684c8 wow64!Wow64LdrpInitialize+0x429 00000000`000ced90 00000000`76d67623 ntdll!LdrpInitializeProcess+0x17e2 00000000`000cf290 00000000`76d5308e ntdll! ?? ::FNODOBFM::`string'+0x2bea0 00000000`000cf300 00000000`00000000 ntdll!LdrInitializeThunk+0xe -
You see that all addresses are 64 bit addresses, (i.e. 00000000`76d5308e rather than 76d5308e), even though it is a 32-bit process.
-
You get errors like the below when trying to run sos commands.
Note: You can get these errors if you don’t have symbols properly set up as well, so this is not the only reason for getting these errors)
 0:000> !eeheap -gc
 Failed to load data access DLL, 0x80004005
 Verify that
 1) you have a recent build of the debugger (6.2.14 or newer)
 2) the file mscordacwks.dll that matches your version of clr.dll is in the version directory
 3) or, if you are debugging a dump file, verify that the file mscordacwks_<arch>_<arch>_<version>.dll is on your symbol path.
 4) you are debugging on the same architecture as the dump file. For example, an IA64 dump file must be debugged on an IA64 machine.
You can also run the debugger command .cordll to control the debuggers load of mscordacwks.dll. .cordll -ve -u -l will do a verbose reload.
If that succeeds, the SOS command should work on retry.
If you are debugging a minidump, you need to make sure that your executable path is pointing to clr.dll as well.
What tools should you use
The best way to capture a process dump in this scenario is to use 32-bit versions of tools like Debug Diag, or adplus+cdb (32 bit debugging tools for windows). You can install the 32-bit versions of these tools on a 64-bit system. In the next version of Debug Diag you will be able to capture 32-bit dumps with the 64-bit version of Debug Diag.
I have mentioned before that you can capture memory dumps with task manager on Vista+, but if you do this on a 64-bit machine you will get a 64-bit dump. You can however use the 32-bit task manager, located in C:\Windows\SysWOW64\taskmgr.exe to get 32-bit dumps. If you want to verify that you are running the 32-bit version of task manager, you can check that taskmgr.exe is listed with *32 in task manager itself.
Edit: Sorry Mark and David, I of course didn’t mean to leave out the nice and very lightweight procdump tool from SysInternals which will capture 32-bit dumps of 32-bit processes even on 64-bit Windows. Thanks for reminding me :)
For some reason I thought that I had written about this tool in an earlier post but a quick search reminded me that this is still in my blog-todo bin.
Edit 2021: the previous edit was based on a conversation in the comments from some of my debugging idols David Solomon and Mark Russinovich - I saved the comments below this post, because you know…
For all other dump capturing tools, I would suggest that you read the documentation to see if there is a 32-bit version (like for procmon where you can pass in the /run32 parameter) or if they will capture 32-bit dumps of 32-bit processes.
Is it important to read the dump with the right “bit” debugger
Yes, to read 32-bit dumps you should use 32-bit windbg (either on a 32-bit or 64-bit OS), and for 64-bit dumps, the machine that you debug the dumps on, needs to be a 64-bit machine, running 64-bit windbg.
Remember that you should also use the 64-bit versions of sos, psscor2, sosex and any other extensions that you might use, if you are debugging a 64-bit dump.
Have a good one, /Tess
David Solomon 29 Sep 2010 10:37 AM
Tess - am really surprised (Russinovich was saddened) that you don’t mention Procdump in your article - that surely would be the preferred tool since it is so lightweight (no install like the tools you suggestion). So just curious - why didn’t you recommend it?
Also, technical detail: there is no such thing as a 32-bit process on 64-bit Windows - a Wow64 process is a full 64-bit process who’s threads start out in 64-bit mode but then switch to 32-bit mode to execute 32-bit code. And when the 32-bit code calls system calls, a switch is made back to 64-bit mode to call 64-bit OS services. You say above in #3 “You see that all addresses are 64 bit addresses, (i.e. 00000000`76d5308e rather than 76d5308e), even though it is a 32-bit process” - in fact, this is proof that it is a 64-bit thread (Windbg can show the 32-bit stack as well).
Mark Russinovich 29 Sep 2010 10:42 AM
And procdump has a significant number of other features that make it much more flexible and applicable to more scenarios….
-Mark (with a heavy heart)
Tess 29 Sep 2010 11:58 PM
Mark, David,
I was actually thinking of adding it to the list before along with a few other dump tools, but the list got a bit long, so I just included debug diag and adplus and left the others under (other dump creation tools).
The reason I singled debug diag and adplus out was because of the types of issues i normally deal with where you often need to do leak tracking or dump on specific exceptions (handled). For gathering dumps on “hangs”, or straight snapshots for memory analysis we usually use task manager (because it is already there). Having said that, I personally like procdump a lot and use it very often, and I do agree that it does have a lot of neat features like gathering dumps on memory/CPU thresholds and based on performance counter info.
As I wrote in the post (in the edit) I thought I had written a post about it already but just realized it is still in my todo bin, but I think it does merit it’s own post.
On a separate note, since I love the nitpicking :) perhaps you should change the help then for procdump technet.microsoft.com/…/dd996900.aspx from “By default Procdump will capture a 32-bit dump of a 32-bit process when running on 64-bit Windows.” to … a 32-bit dump of a 64-bit process running 32-bit code:) … sorry couldn’t resist, thanks for the clarification btw…
